Swiss vs Immigrants from Guatemala 7th Grade
COMPARE
Swiss
Immigrants from Guatemala
7th Grade
7th Grade Comparison
Swiss
Immigrants from Guatemala
97.3%
7TH GRADE
100.0/ 100
METRIC RATING
35th/ 347
METRIC RANK
91.3%
7TH GRADE
0.0/ 100
METRIC RATING
343rd/ 347
METRIC RANK
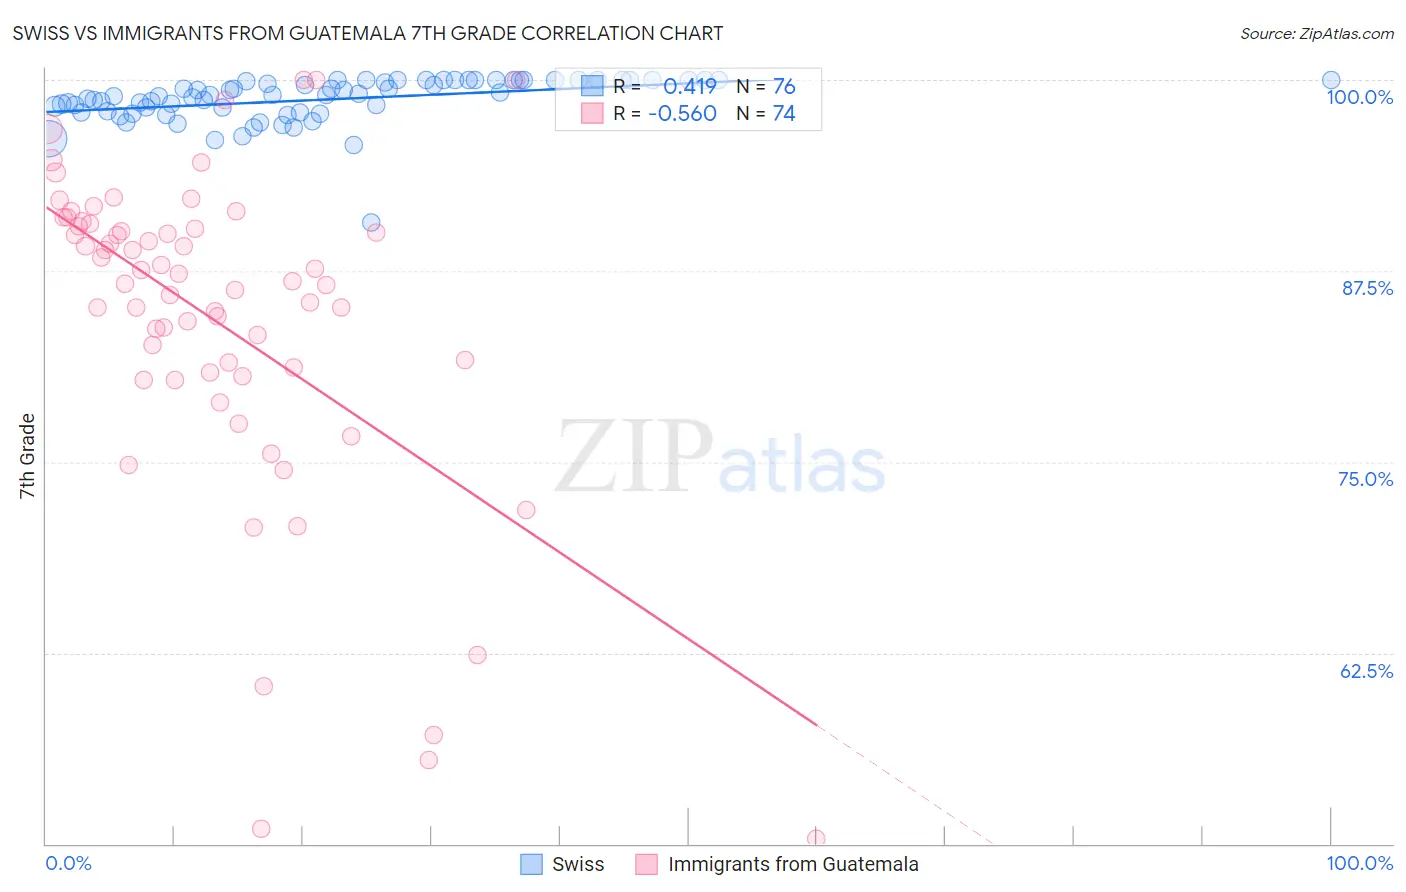
Swiss vs Immigrants from Guatemala 7th Grade Correlation Chart
The statistical analysis conducted on geographies consisting of 465,021,856 people shows a moderate positive correlation between the proportion of Swiss and percentage of population with at least 7th grade education in the United States with a correlation coefficient (R) of 0.419 and weighted average of 97.3%. Similarly, the statistical analysis conducted on geographies consisting of 377,286,142 people shows a substantial negative correlation between the proportion of Immigrants from Guatemala and percentage of population with at least 7th grade education in the United States with a correlation coefficient (R) of -0.560 and weighted average of 91.3%, a difference of 6.5%.
7th Grade Correlation Summary
| Measurement | Swiss | Immigrants from Guatemala |
| Minimum | 90.7% | 50.3% |
| Maximum | 100.0% | 100.0% |
| Range | 9.3% | 49.7% |
| Mean | 98.7% | 84.2% |
| Median | 99.0% | 86.7% |
| Interquartile 25% (IQ1) | 97.9% | 80.8% |
| Interquartile 75% (IQ3) | 100.0% | 90.5% |
| Interquartile Range (IQR) | 2.1% | 9.6% |
| Standard Deviation (Sample) | 1.5% | 10.7% |
| Standard Deviation (Population) | 1.5% | 10.6% |
Similar Demographics by 7th Grade
Demographics Similar to Swiss by 7th Grade
In terms of 7th grade, the demographic groups most similar to Swiss are Alaska Native (97.3%, a difference of 0.030%), Hungarian (97.2%, a difference of 0.040%), British (97.2%, a difference of 0.050%), Chippewa (97.3%, a difference of 0.060%), and Belgian (97.2%, a difference of 0.060%).
| Demographics | Rating | Rank | 7th Grade |
| Sioux | 100.0 /100 | #28 | Exceptional 97.4% |
| Scandinavians | 100.0 /100 | #29 | Exceptional 97.4% |
| Czechs | 100.0 /100 | #30 | Exceptional 97.4% |
| Europeans | 100.0 /100 | #31 | Exceptional 97.3% |
| Italians | 100.0 /100 | #32 | Exceptional 97.3% |
| Chippewa | 100.0 /100 | #33 | Exceptional 97.3% |
| Alaska Natives | 100.0 /100 | #34 | Exceptional 97.3% |
| Swiss | 100.0 /100 | #35 | Exceptional 97.3% |
| Hungarians | 100.0 /100 | #36 | Exceptional 97.2% |
| British | 100.0 /100 | #37 | Exceptional 97.2% |
| Belgians | 100.0 /100 | #38 | Exceptional 97.2% |
| Latvians | 100.0 /100 | #39 | Exceptional 97.2% |
| Luxembourgers | 100.0 /100 | #40 | Exceptional 97.2% |
| Eastern Europeans | 100.0 /100 | #41 | Exceptional 97.2% |
| Chinese | 99.9 /100 | #42 | Exceptional 97.1% |
Demographics Similar to Immigrants from Guatemala by 7th Grade
In terms of 7th grade, the demographic groups most similar to Immigrants from Guatemala are Salvadoran (91.5%, a difference of 0.16%), Immigrants from Central America (91.0%, a difference of 0.36%), Guatemalan (91.7%, a difference of 0.43%), Immigrants from El Salvador (90.9%, a difference of 0.43%), and Yakama (91.7%, a difference of 0.45%).
| Demographics | Rating | Rank | 7th Grade |
| Immigrants | Armenia | 0.0 /100 | #333 | Tragic 92.7% |
| Immigrants | Yemen | 0.0 /100 | #334 | Tragic 92.6% |
| Mexican American Indians | 0.0 /100 | #335 | Tragic 92.6% |
| Immigrants | Honduras | 0.0 /100 | #336 | Tragic 92.5% |
| Immigrants | Latin America | 0.0 /100 | #337 | Tragic 92.2% |
| Central Americans | 0.0 /100 | #338 | Tragic 92.1% |
| Mexicans | 0.0 /100 | #339 | Tragic 91.9% |
| Yakama | 0.0 /100 | #340 | Tragic 91.7% |
| Guatemalans | 0.0 /100 | #341 | Tragic 91.7% |
| Salvadorans | 0.0 /100 | #342 | Tragic 91.5% |
| Immigrants | Guatemala | 0.0 /100 | #343 | Tragic 91.3% |
| Immigrants | Central America | 0.0 /100 | #344 | Tragic 91.0% |
| Immigrants | El Salvador | 0.0 /100 | #345 | Tragic 90.9% |
| Immigrants | Mexico | 0.0 /100 | #346 | Tragic 90.7% |
| Spanish American Indians | 0.0 /100 | #347 | Tragic 90.3% |