Swiss vs Immigrants from Guatemala Divorced or Separated
COMPARE
Swiss
Immigrants from Guatemala
Divorced or Separated
Divorced or Separated Comparison
Swiss
Immigrants from Guatemala
12.0%
DIVORCED OR SEPARATED
63.6/ 100
METRIC RATING
164th/ 347
METRIC RANK
12.2%
DIVORCED OR SEPARATED
23.2/ 100
METRIC RATING
203rd/ 347
METRIC RANK
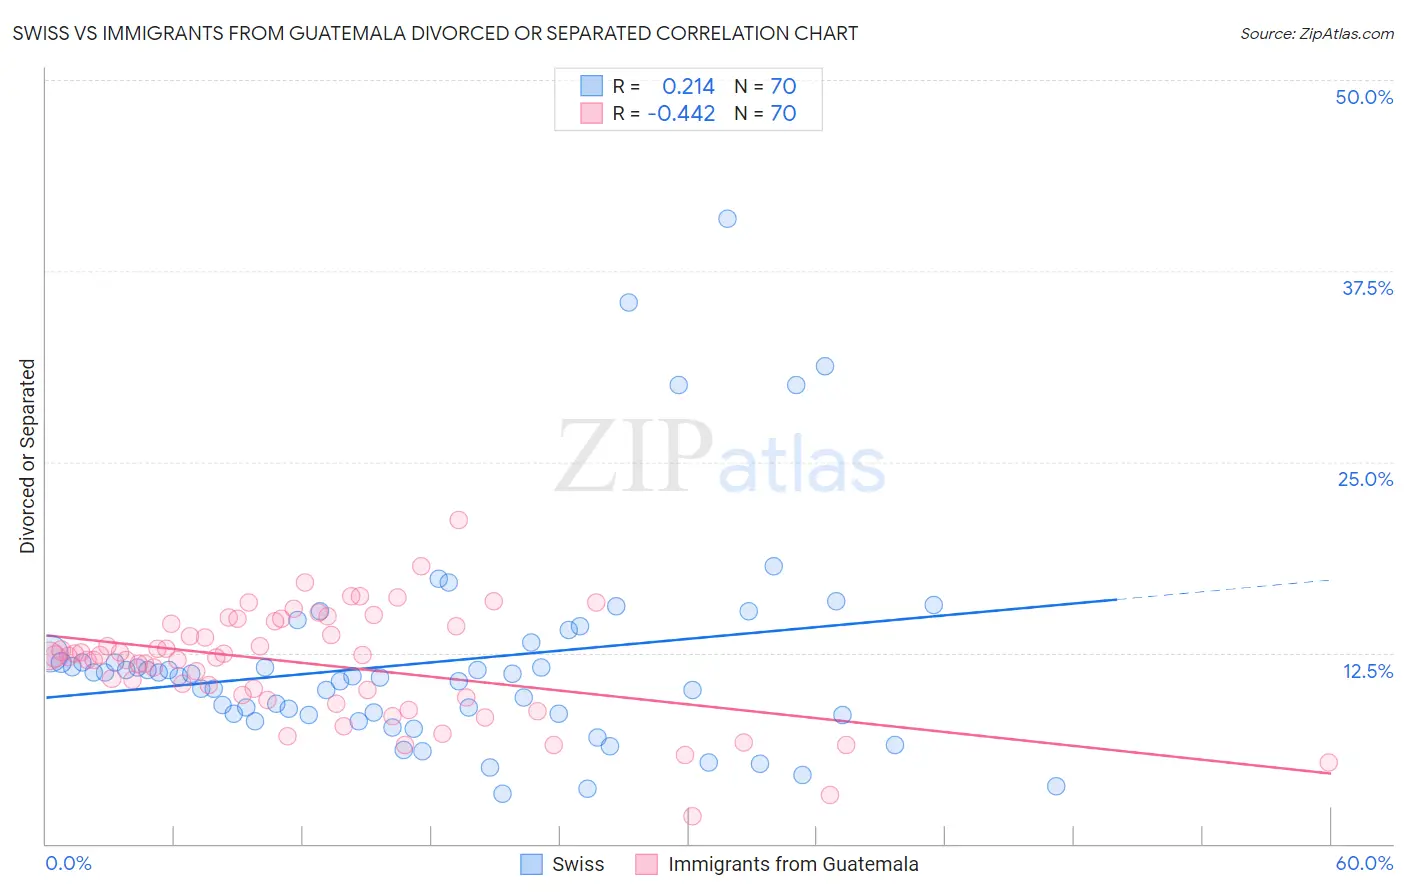
Swiss vs Immigrants from Guatemala Divorced or Separated Correlation Chart
The statistical analysis conducted on geographies consisting of 464,828,209 people shows a weak positive correlation between the proportion of Swiss and percentage of population currently divorced or separated in the United States with a correlation coefficient (R) of 0.214 and weighted average of 12.0%. Similarly, the statistical analysis conducted on geographies consisting of 377,229,357 people shows a moderate negative correlation between the proportion of Immigrants from Guatemala and percentage of population currently divorced or separated in the United States with a correlation coefficient (R) of -0.442 and weighted average of 12.2%, a difference of 1.5%.
Divorced or Separated Correlation Summary
| Measurement | Swiss | Immigrants from Guatemala |
| Minimum | 3.3% | 1.8% |
| Maximum | 40.9% | 21.2% |
| Range | 37.6% | 19.4% |
| Mean | 11.9% | 11.7% |
| Median | 11.0% | 12.3% |
| Interquartile 25% (IQ1) | 8.5% | 9.6% |
| Interquartile 75% (IQ3) | 12.4% | 14.4% |
| Interquartile Range (IQR) | 4.0% | 4.8% |
| Standard Deviation (Sample) | 7.0% | 3.6% |
| Standard Deviation (Population) | 6.9% | 3.5% |
Similar Demographics by Divorced or Separated
Demographics Similar to Swiss by Divorced or Separated
In terms of divorced or separated, the demographic groups most similar to Swiss are Navajo (12.0%, a difference of 0.010%), Samoan (12.0%, a difference of 0.020%), Marshallese (12.0%, a difference of 0.040%), German Russian (12.0%, a difference of 0.070%), and Immigrants from Scotland (12.0%, a difference of 0.080%).
| Demographics | Rating | Rank | Divorced or Separated |
| Immigrants | Brazil | 68.8 /100 | #157 | Good 12.0% |
| Icelanders | 66.0 /100 | #158 | Good 12.0% |
| Immigrants | Barbados | 66.0 /100 | #159 | Good 12.0% |
| Immigrants | Scotland | 65.8 /100 | #160 | Good 12.0% |
| Marshallese | 64.6 /100 | #161 | Good 12.0% |
| Samoans | 64.3 /100 | #162 | Good 12.0% |
| Navajo | 63.9 /100 | #163 | Good 12.0% |
| Swiss | 63.6 /100 | #164 | Good 12.0% |
| German Russians | 61.8 /100 | #165 | Good 12.0% |
| Tohono O'odham | 60.4 /100 | #166 | Good 12.0% |
| Ethiopians | 58.5 /100 | #167 | Average 12.0% |
| Serbians | 57.1 /100 | #168 | Average 12.0% |
| Immigrants | Peru | 57.0 /100 | #169 | Average 12.0% |
| Mexican American Indians | 55.8 /100 | #170 | Average 12.0% |
| Costa Ricans | 53.3 /100 | #171 | Average 12.0% |
Demographics Similar to Immigrants from Guatemala by Divorced or Separated
In terms of divorced or separated, the demographic groups most similar to Immigrants from Guatemala are Portuguese (12.2%, a difference of 0.020%), Kenyan (12.2%, a difference of 0.070%), Immigrants from Costa Rica (12.2%, a difference of 0.10%), Slovak (12.2%, a difference of 0.11%), and Mexican (12.2%, a difference of 0.11%).
| Demographics | Rating | Rank | Divorced or Separated |
| Immigrants | Burma/Myanmar | 30.4 /100 | #196 | Fair 12.1% |
| Immigrants | Africa | 30.3 /100 | #197 | Fair 12.1% |
| Nigerians | 30.1 /100 | #198 | Fair 12.1% |
| Central Americans | 29.4 /100 | #199 | Fair 12.1% |
| South Americans | 28.6 /100 | #200 | Fair 12.2% |
| Guatemalans | 26.9 /100 | #201 | Fair 12.2% |
| Portuguese | 23.5 /100 | #202 | Fair 12.2% |
| Immigrants | Guatemala | 23.2 /100 | #203 | Fair 12.2% |
| Kenyans | 21.8 /100 | #204 | Fair 12.2% |
| Immigrants | Costa Rica | 21.3 /100 | #205 | Fair 12.2% |
| Slovaks | 21.0 /100 | #206 | Fair 12.2% |
| Mexicans | 21.0 /100 | #207 | Fair 12.2% |
| Immigrants | Ghana | 18.8 /100 | #208 | Poor 12.2% |
| Immigrants | Trinidad and Tobago | 17.8 /100 | #209 | Poor 12.2% |
| Slavs | 17.0 /100 | #210 | Poor 12.2% |