Bulgarian vs Immigrants from Ecuador Associate's Degree
COMPARE
Bulgarian
Immigrants from Ecuador
Associate's Degree
Associate's Degree Comparison
Bulgarians
Immigrants from Ecuador
53.3%
ASSOCIATE'S DEGREE
100.0/ 100
METRIC RATING
34th/ 347
METRIC RANK
42.2%
ASSOCIATE'S DEGREE
0.8/ 100
METRIC RATING
248th/ 347
METRIC RANK
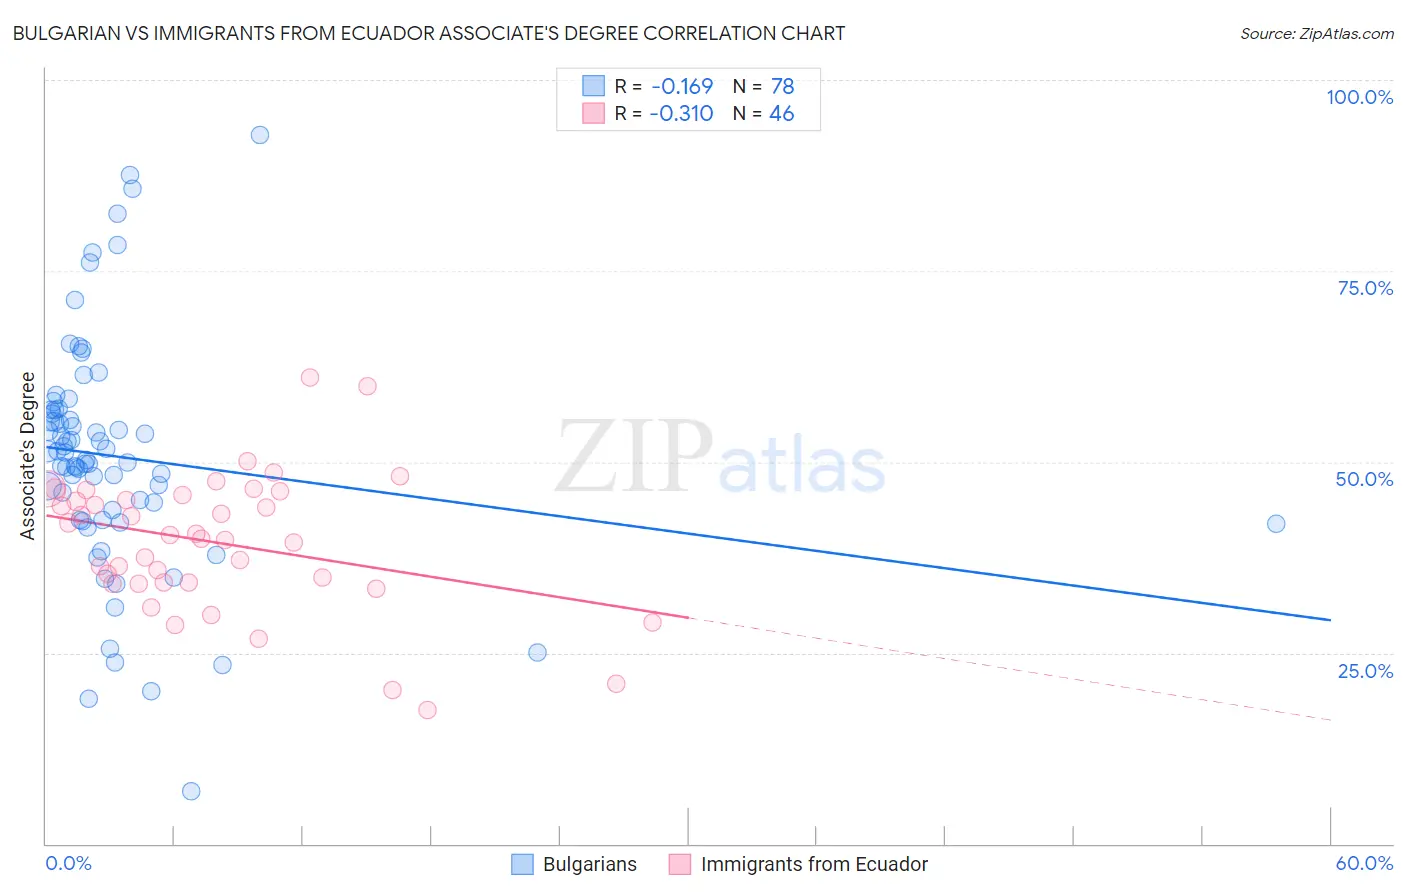
Bulgarian vs Immigrants from Ecuador Associate's Degree Correlation Chart
The statistical analysis conducted on geographies consisting of 205,619,803 people shows a poor negative correlation between the proportion of Bulgarians and percentage of population with at least associate's degree education in the United States with a correlation coefficient (R) of -0.169 and weighted average of 53.3%. Similarly, the statistical analysis conducted on geographies consisting of 271,013,289 people shows a mild negative correlation between the proportion of Immigrants from Ecuador and percentage of population with at least associate's degree education in the United States with a correlation coefficient (R) of -0.310 and weighted average of 42.2%, a difference of 26.3%.
Associate's Degree Correlation Summary
| Measurement | Bulgarian | Immigrants from Ecuador |
| Minimum | 6.9% | 17.6% |
| Maximum | 92.7% | 61.0% |
| Range | 85.9% | 43.4% |
| Mean | 50.7% | 39.4% |
| Median | 50.7% | 40.1% |
| Interquartile 25% (IQ1) | 42.4% | 34.2% |
| Interquartile 75% (IQ3) | 56.8% | 45.6% |
| Interquartile Range (IQR) | 14.4% | 11.4% |
| Standard Deviation (Sample) | 15.5% | 9.0% |
| Standard Deviation (Population) | 15.4% | 8.9% |
Similar Demographics by Associate's Degree
Demographics Similar to Bulgarians by Associate's Degree
In terms of associate's degree, the demographic groups most similar to Bulgarians are Russian (53.2%, a difference of 0.060%), Israeli (53.4%, a difference of 0.19%), Immigrants from Turkey (53.4%, a difference of 0.31%), Immigrants from Northern Europe (53.5%, a difference of 0.34%), and Immigrants from Russia (53.1%, a difference of 0.35%).
| Demographics | Rating | Rank | Associate's Degree |
| Latvians | 100.0 /100 | #27 | Exceptional 53.9% |
| Turks | 100.0 /100 | #28 | Exceptional 53.9% |
| Immigrants | France | 100.0 /100 | #29 | Exceptional 53.9% |
| Immigrants | Sri Lanka | 100.0 /100 | #30 | Exceptional 53.7% |
| Immigrants | Northern Europe | 100.0 /100 | #31 | Exceptional 53.5% |
| Immigrants | Turkey | 100.0 /100 | #32 | Exceptional 53.4% |
| Israelis | 100.0 /100 | #33 | Exceptional 53.4% |
| Bulgarians | 100.0 /100 | #34 | Exceptional 53.3% |
| Russians | 100.0 /100 | #35 | Exceptional 53.2% |
| Immigrants | Russia | 100.0 /100 | #36 | Exceptional 53.1% |
| Immigrants | Denmark | 100.0 /100 | #37 | Exceptional 53.1% |
| Mongolians | 100.0 /100 | #38 | Exceptional 53.0% |
| Immigrants | Belarus | 99.9 /100 | #39 | Exceptional 52.8% |
| Immigrants | Latvia | 99.9 /100 | #40 | Exceptional 52.8% |
| Immigrants | Saudi Arabia | 99.9 /100 | #41 | Exceptional 52.6% |
Demographics Similar to Immigrants from Ecuador by Associate's Degree
In terms of associate's degree, the demographic groups most similar to Immigrants from Ecuador are Immigrants from Fiji (42.2%, a difference of 0.090%), Jamaican (42.1%, a difference of 0.14%), U.S. Virgin Islander (42.1%, a difference of 0.16%), Delaware (42.3%, a difference of 0.18%), and Immigrants from Bahamas (42.1%, a difference of 0.18%).
| Demographics | Rating | Rank | Associate's Degree |
| British West Indians | 1.0 /100 | #241 | Tragic 42.4% |
| Immigrants | West Indies | 1.0 /100 | #242 | Tragic 42.4% |
| Guyanese | 1.0 /100 | #243 | Tragic 42.3% |
| Immigrants | Liberia | 0.9 /100 | #244 | Tragic 42.3% |
| Immigrants | Cambodia | 0.9 /100 | #245 | Tragic 42.3% |
| Delaware | 0.9 /100 | #246 | Tragic 42.3% |
| Immigrants | Fiji | 0.8 /100 | #247 | Tragic 42.2% |
| Immigrants | Ecuador | 0.8 /100 | #248 | Tragic 42.2% |
| Jamaicans | 0.7 /100 | #249 | Tragic 42.1% |
| U.S. Virgin Islanders | 0.7 /100 | #250 | Tragic 42.1% |
| Immigrants | Bahamas | 0.7 /100 | #251 | Tragic 42.1% |
| French American Indians | 0.6 /100 | #252 | Tragic 42.0% |
| Indonesians | 0.6 /100 | #253 | Tragic 41.9% |
| Cubans | 0.6 /100 | #254 | Tragic 41.9% |
| Immigrants | Guyana | 0.5 /100 | #255 | Tragic 41.8% |