Immigrants from India vs Immigrants from Ecuador Associate's Degree
COMPARE
Immigrants from India
Immigrants from Ecuador
Associate's Degree
Associate's Degree Comparison
Immigrants from India
Immigrants from Ecuador
58.5%
ASSOCIATE'S DEGREE
100.0/ 100
METRIC RATING
3rd/ 347
METRIC RANK
42.2%
ASSOCIATE'S DEGREE
0.8/ 100
METRIC RATING
248th/ 347
METRIC RANK
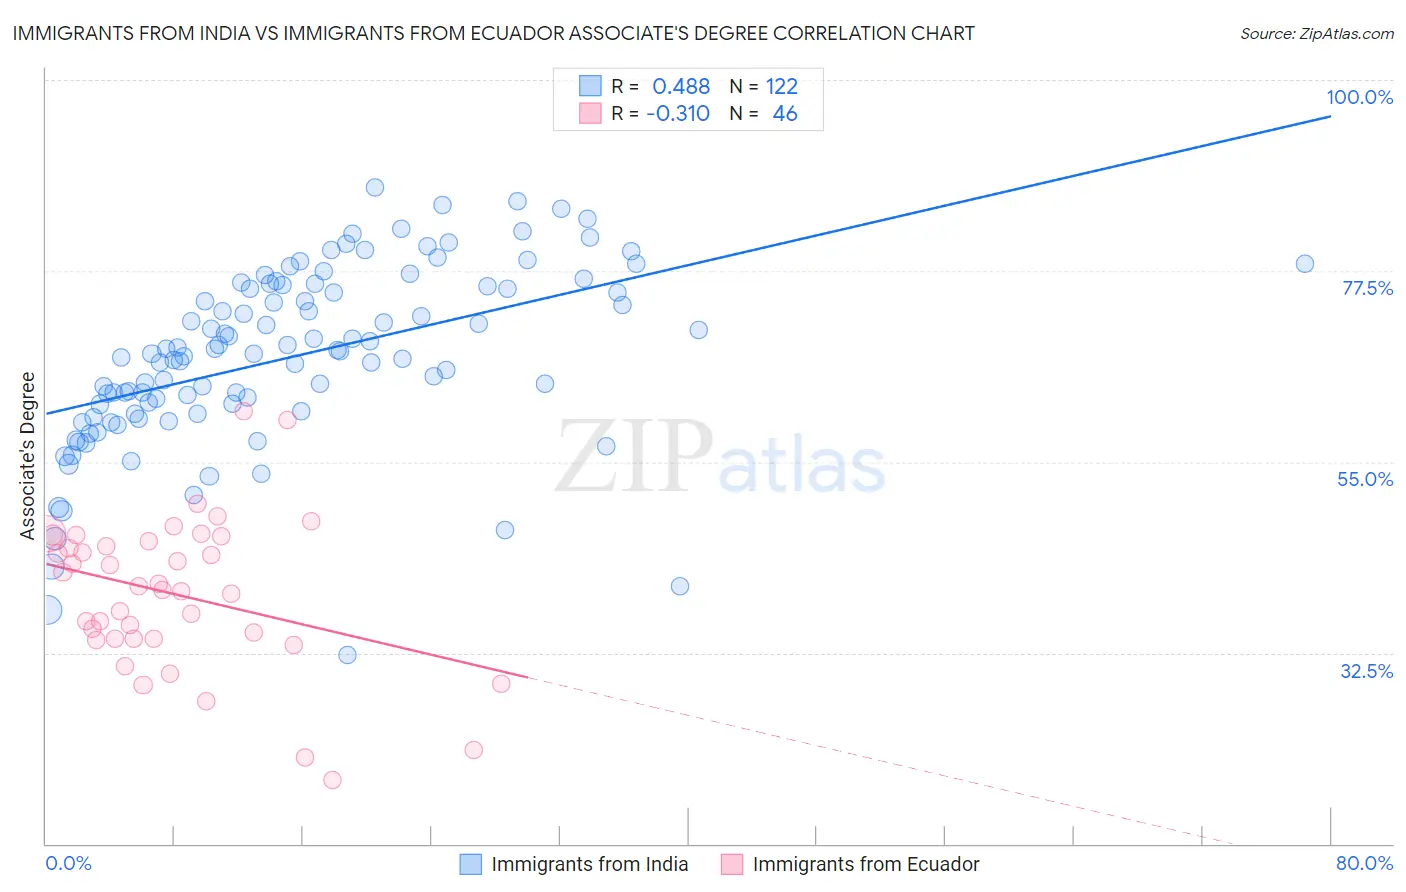
Immigrants from India vs Immigrants from Ecuador Associate's Degree Correlation Chart
The statistical analysis conducted on geographies consisting of 434,068,008 people shows a moderate positive correlation between the proportion of Immigrants from India and percentage of population with at least associate's degree education in the United States with a correlation coefficient (R) of 0.488 and weighted average of 58.5%. Similarly, the statistical analysis conducted on geographies consisting of 271,013,289 people shows a mild negative correlation between the proportion of Immigrants from Ecuador and percentage of population with at least associate's degree education in the United States with a correlation coefficient (R) of -0.310 and weighted average of 42.2%, a difference of 38.8%.
Associate's Degree Correlation Summary
| Measurement | Immigrants from India | Immigrants from Ecuador |
| Minimum | 32.2% | 17.6% |
| Maximum | 87.3% | 61.0% |
| Range | 55.1% | 43.4% |
| Mean | 67.4% | 39.4% |
| Median | 67.9% | 40.1% |
| Interquartile 25% (IQ1) | 60.9% | 34.2% |
| Interquartile 75% (IQ3) | 75.8% | 45.6% |
| Interquartile Range (IQR) | 14.8% | 11.4% |
| Standard Deviation (Sample) | 10.5% | 9.0% |
| Standard Deviation (Population) | 10.5% | 8.9% |
Similar Demographics by Associate's Degree
Demographics Similar to Immigrants from India by Associate's Degree
In terms of associate's degree, the demographic groups most similar to Immigrants from India are Immigrants from Taiwan (58.4%, a difference of 0.25%), Immigrants from Singapore (58.9%, a difference of 0.66%), Iranian (58.2%, a difference of 0.66%), Okinawan (57.7%, a difference of 1.5%), and Immigrants from Iran (57.7%, a difference of 1.5%).
| Demographics | Rating | Rank | Associate's Degree |
| Filipinos | 100.0 /100 | #1 | Exceptional 59.8% |
| Immigrants | Singapore | 100.0 /100 | #2 | Exceptional 58.9% |
| Immigrants | India | 100.0 /100 | #3 | Exceptional 58.5% |
| Immigrants | Taiwan | 100.0 /100 | #4 | Exceptional 58.4% |
| Iranians | 100.0 /100 | #5 | Exceptional 58.2% |
| Okinawans | 100.0 /100 | #6 | Exceptional 57.7% |
| Immigrants | Iran | 100.0 /100 | #7 | Exceptional 57.7% |
| Thais | 100.0 /100 | #8 | Exceptional 57.4% |
| Immigrants | Israel | 100.0 /100 | #9 | Exceptional 56.8% |
| Cypriots | 100.0 /100 | #10 | Exceptional 56.4% |
| Immigrants | Australia | 100.0 /100 | #11 | Exceptional 55.8% |
| Immigrants | South Central Asia | 100.0 /100 | #12 | Exceptional 55.7% |
| Immigrants | China | 100.0 /100 | #13 | Exceptional 55.5% |
| Immigrants | Hong Kong | 100.0 /100 | #14 | Exceptional 55.4% |
| Immigrants | Eastern Asia | 100.0 /100 | #15 | Exceptional 55.4% |
Demographics Similar to Immigrants from Ecuador by Associate's Degree
In terms of associate's degree, the demographic groups most similar to Immigrants from Ecuador are Immigrants from Fiji (42.2%, a difference of 0.090%), Jamaican (42.1%, a difference of 0.14%), U.S. Virgin Islander (42.1%, a difference of 0.16%), Delaware (42.3%, a difference of 0.18%), and Immigrants from Bahamas (42.1%, a difference of 0.18%).
| Demographics | Rating | Rank | Associate's Degree |
| British West Indians | 1.0 /100 | #241 | Tragic 42.4% |
| Immigrants | West Indies | 1.0 /100 | #242 | Tragic 42.4% |
| Guyanese | 1.0 /100 | #243 | Tragic 42.3% |
| Immigrants | Liberia | 0.9 /100 | #244 | Tragic 42.3% |
| Immigrants | Cambodia | 0.9 /100 | #245 | Tragic 42.3% |
| Delaware | 0.9 /100 | #246 | Tragic 42.3% |
| Immigrants | Fiji | 0.8 /100 | #247 | Tragic 42.2% |
| Immigrants | Ecuador | 0.8 /100 | #248 | Tragic 42.2% |
| Jamaicans | 0.7 /100 | #249 | Tragic 42.1% |
| U.S. Virgin Islanders | 0.7 /100 | #250 | Tragic 42.1% |
| Immigrants | Bahamas | 0.7 /100 | #251 | Tragic 42.1% |
| French American Indians | 0.6 /100 | #252 | Tragic 42.0% |
| Indonesians | 0.6 /100 | #253 | Tragic 41.9% |
| Cubans | 0.6 /100 | #254 | Tragic 41.9% |
| Immigrants | Guyana | 0.5 /100 | #255 | Tragic 41.8% |