Jordanian vs Immigrants from Ecuador Associate's Degree
COMPARE
Jordanian
Immigrants from Ecuador
Associate's Degree
Associate's Degree Comparison
Jordanians
Immigrants from Ecuador
49.2%
ASSOCIATE'S DEGREE
96.6/ 100
METRIC RATING
108th/ 347
METRIC RANK
42.2%
ASSOCIATE'S DEGREE
0.8/ 100
METRIC RATING
248th/ 347
METRIC RANK
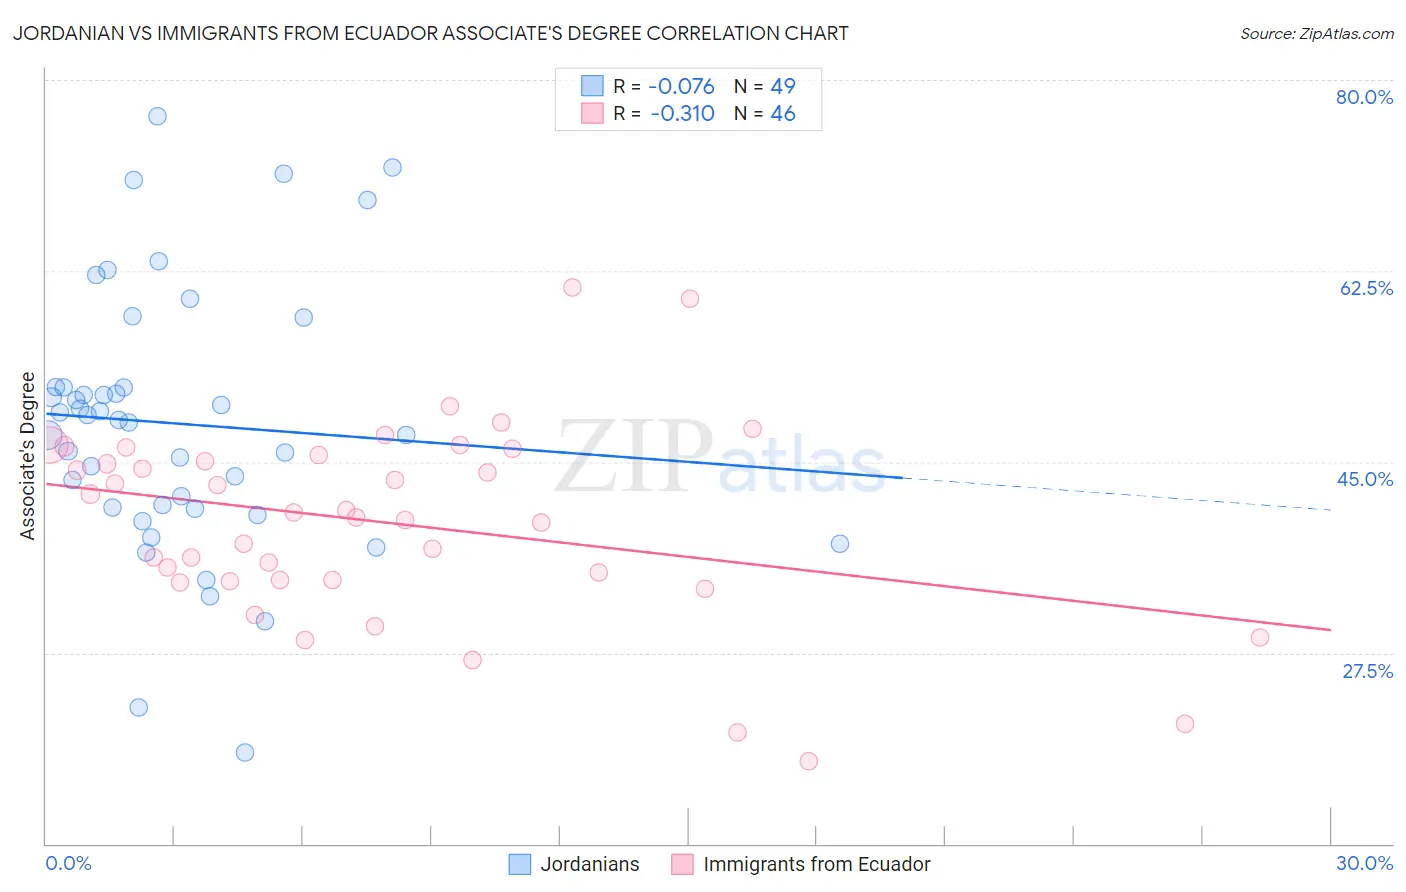
Jordanian vs Immigrants from Ecuador Associate's Degree Correlation Chart
The statistical analysis conducted on geographies consisting of 166,424,117 people shows a slight negative correlation between the proportion of Jordanians and percentage of population with at least associate's degree education in the United States with a correlation coefficient (R) of -0.076 and weighted average of 49.2%. Similarly, the statistical analysis conducted on geographies consisting of 271,013,289 people shows a mild negative correlation between the proportion of Immigrants from Ecuador and percentage of population with at least associate's degree education in the United States with a correlation coefficient (R) of -0.310 and weighted average of 42.2%, a difference of 16.8%.
Associate's Degree Correlation Summary
| Measurement | Jordanian | Immigrants from Ecuador |
| Minimum | 18.4% | 17.6% |
| Maximum | 76.6% | 61.0% |
| Range | 58.2% | 43.4% |
| Mean | 48.5% | 39.4% |
| Median | 48.8% | 40.1% |
| Interquartile 25% (IQ1) | 40.7% | 34.2% |
| Interquartile 75% (IQ3) | 51.9% | 45.6% |
| Interquartile Range (IQR) | 11.1% | 11.4% |
| Standard Deviation (Sample) | 12.2% | 9.0% |
| Standard Deviation (Population) | 12.0% | 8.9% |
Similar Demographics by Associate's Degree
Demographics Similar to Jordanians by Associate's Degree
In terms of associate's degree, the demographic groups most similar to Jordanians are Syrian (49.3%, a difference of 0.060%), Immigrants from Italy (49.3%, a difference of 0.090%), Croatian (49.3%, a difference of 0.10%), Immigrants from Morocco (49.2%, a difference of 0.13%), and Venezuelan (49.4%, a difference of 0.24%).
| Demographics | Rating | Rank | Associate's Degree |
| Northern Europeans | 97.3 /100 | #101 | Exceptional 49.5% |
| Chileans | 97.3 /100 | #102 | Exceptional 49.4% |
| Ukrainians | 97.1 /100 | #103 | Exceptional 49.4% |
| Venezuelans | 97.0 /100 | #104 | Exceptional 49.4% |
| Croatians | 96.8 /100 | #105 | Exceptional 49.3% |
| Immigrants | Italy | 96.7 /100 | #106 | Exceptional 49.3% |
| Syrians | 96.7 /100 | #107 | Exceptional 49.3% |
| Jordanians | 96.6 /100 | #108 | Exceptional 49.2% |
| Immigrants | Morocco | 96.3 /100 | #109 | Exceptional 49.2% |
| Austrians | 95.8 /100 | #110 | Exceptional 49.1% |
| Immigrants | Venezuela | 95.8 /100 | #111 | Exceptional 49.1% |
| Immigrants | Chile | 95.3 /100 | #112 | Exceptional 49.0% |
| Palestinians | 95.3 /100 | #113 | Exceptional 49.0% |
| Arabs | 95.3 /100 | #114 | Exceptional 49.0% |
| Luxembourgers | 95.1 /100 | #115 | Exceptional 48.9% |
Demographics Similar to Immigrants from Ecuador by Associate's Degree
In terms of associate's degree, the demographic groups most similar to Immigrants from Ecuador are Immigrants from Fiji (42.2%, a difference of 0.090%), Jamaican (42.1%, a difference of 0.14%), U.S. Virgin Islander (42.1%, a difference of 0.16%), Delaware (42.3%, a difference of 0.18%), and Immigrants from Bahamas (42.1%, a difference of 0.18%).
| Demographics | Rating | Rank | Associate's Degree |
| British West Indians | 1.0 /100 | #241 | Tragic 42.4% |
| Immigrants | West Indies | 1.0 /100 | #242 | Tragic 42.4% |
| Guyanese | 1.0 /100 | #243 | Tragic 42.3% |
| Immigrants | Liberia | 0.9 /100 | #244 | Tragic 42.3% |
| Immigrants | Cambodia | 0.9 /100 | #245 | Tragic 42.3% |
| Delaware | 0.9 /100 | #246 | Tragic 42.3% |
| Immigrants | Fiji | 0.8 /100 | #247 | Tragic 42.2% |
| Immigrants | Ecuador | 0.8 /100 | #248 | Tragic 42.2% |
| Jamaicans | 0.7 /100 | #249 | Tragic 42.1% |
| U.S. Virgin Islanders | 0.7 /100 | #250 | Tragic 42.1% |
| Immigrants | Bahamas | 0.7 /100 | #251 | Tragic 42.1% |
| French American Indians | 0.6 /100 | #252 | Tragic 42.0% |
| Indonesians | 0.6 /100 | #253 | Tragic 41.9% |
| Cubans | 0.6 /100 | #254 | Tragic 41.9% |
| Immigrants | Guyana | 0.5 /100 | #255 | Tragic 41.8% |