Swedish vs Inupiat Householder Income Ages 45 - 64 years
COMPARE
Swedish
Inupiat
Householder Income Ages 45 - 64 years
Householder Income Ages 45 - 64 years Comparison
Swedes
Inupiat
$106,377
HOUSEHOLDER INCOME AGES 45 - 64 YEARS
95.4/ 100
METRIC RATING
112th/ 347
METRIC RANK
$91,355
HOUSEHOLDER INCOME AGES 45 - 64 YEARS
1.1/ 100
METRIC RATING
242nd/ 347
METRIC RANK
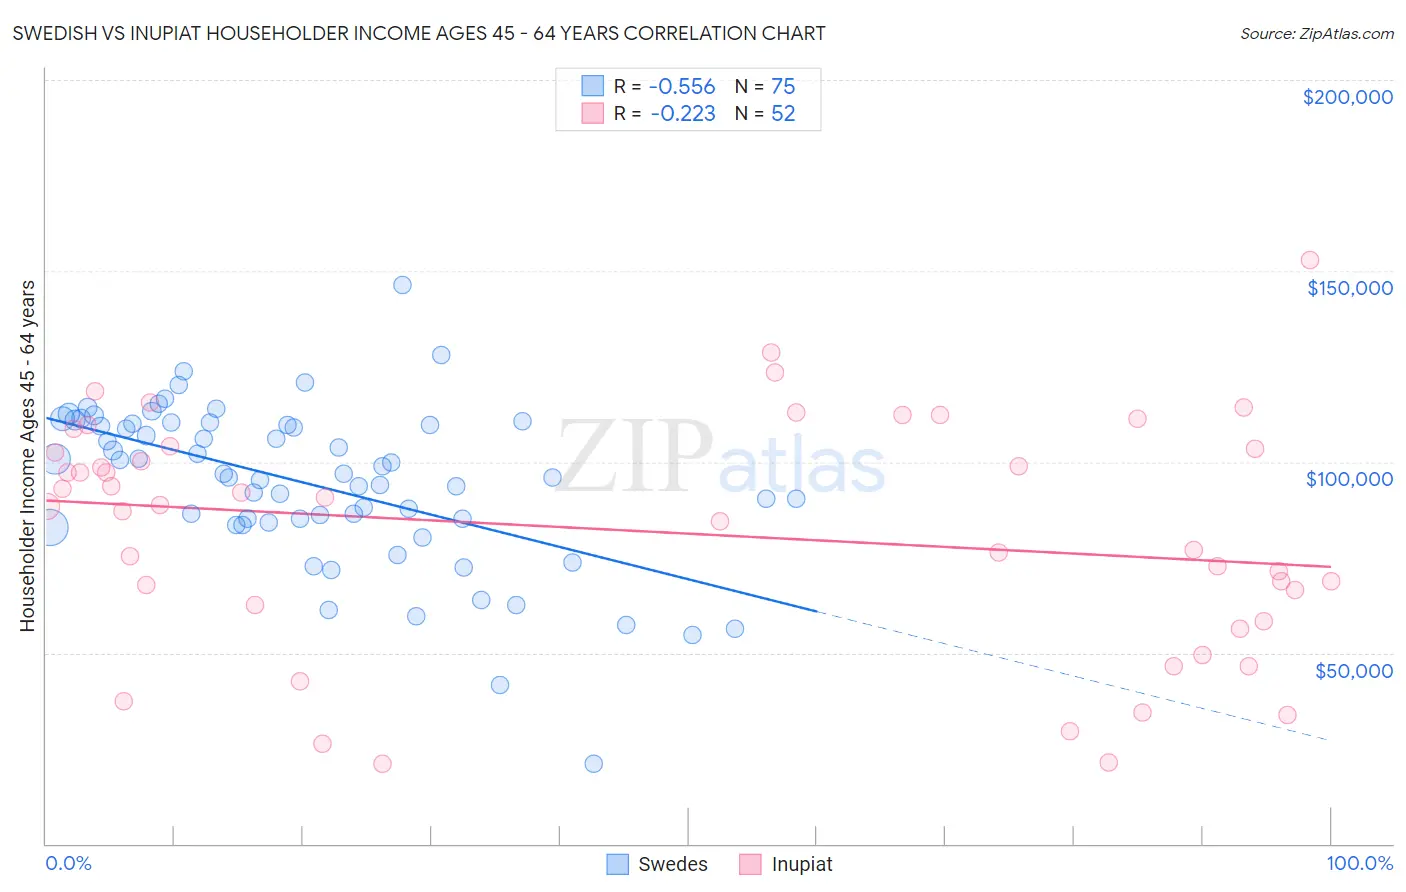
Swedish vs Inupiat Householder Income Ages 45 - 64 years Correlation Chart
The statistical analysis conducted on geographies consisting of 536,739,042 people shows a substantial negative correlation between the proportion of Swedes and household income with householder between the ages 45 and 64 in the United States with a correlation coefficient (R) of -0.556 and weighted average of $106,377. Similarly, the statistical analysis conducted on geographies consisting of 96,273,732 people shows a weak negative correlation between the proportion of Inupiat and household income with householder between the ages 45 and 64 in the United States with a correlation coefficient (R) of -0.223 and weighted average of $91,355, a difference of 16.4%.
Householder Income Ages 45 - 64 years Correlation Summary
| Measurement | Swedish | Inupiat |
| Minimum | $21,055 | $20,833 |
| Maximum | $146,263 | $152,917 |
| Range | $125,208 | $132,084 |
| Mean | $94,232 | $81,669 |
| Median | $96,778 | $88,444 |
| Interquartile 25% (IQ1) | $84,274 | $60,416 |
| Interquartile 75% (IQ3) | $109,981 | $103,725 |
| Interquartile Range (IQR) | $25,707 | $43,309 |
| Standard Deviation (Sample) | $21,129 | $30,923 |
| Standard Deviation (Population) | $20,987 | $30,625 |
Similar Demographics by Householder Income Ages 45 - 64 years
Demographics Similar to Swedes by Householder Income Ages 45 - 64 years
In terms of householder income ages 45 - 64 years, the demographic groups most similar to Swedes are European ($106,367, a difference of 0.010%), Immigrants from Vietnam ($106,417, a difference of 0.040%), Immigrants from Poland ($106,319, a difference of 0.060%), Immigrants from Brazil ($106,470, a difference of 0.090%), and Immigrants from Kuwait ($106,285, a difference of 0.090%).
| Demographics | Rating | Rank | Householder Income Ages 45 - 64 years |
| Macedonians | 96.7 /100 | #105 | Exceptional $107,074 |
| Armenians | 96.6 /100 | #106 | Exceptional $107,002 |
| Immigrants | Fiji | 96.5 /100 | #107 | Exceptional $106,952 |
| Zimbabweans | 96.3 /100 | #108 | Exceptional $106,849 |
| Chileans | 95.9 /100 | #109 | Exceptional $106,611 |
| Immigrants | Brazil | 95.6 /100 | #110 | Exceptional $106,470 |
| Immigrants | Vietnam | 95.5 /100 | #111 | Exceptional $106,417 |
| Swedes | 95.4 /100 | #112 | Exceptional $106,377 |
| Europeans | 95.4 /100 | #113 | Exceptional $106,367 |
| Immigrants | Poland | 95.3 /100 | #114 | Exceptional $106,319 |
| Immigrants | Kuwait | 95.2 /100 | #115 | Exceptional $106,285 |
| British | 95.2 /100 | #116 | Exceptional $106,264 |
| Albanians | 95.1 /100 | #117 | Exceptional $106,243 |
| Immigrants | Western Asia | 95.0 /100 | #118 | Exceptional $106,217 |
| Immigrants | Jordan | 94.9 /100 | #119 | Exceptional $106,164 |
Demographics Similar to Inupiat by Householder Income Ages 45 - 64 years
In terms of householder income ages 45 - 64 years, the demographic groups most similar to Inupiat are Trinidadian and Tobagonian ($91,357, a difference of 0.0%), Immigrants from Trinidad and Tobago ($91,347, a difference of 0.010%), Immigrants from Burma/Myanmar ($91,385, a difference of 0.030%), Immigrants from Middle Africa ($91,293, a difference of 0.070%), and Immigrants from Ecuador ($91,462, a difference of 0.12%).
| Demographics | Rating | Rank | Householder Income Ages 45 - 64 years |
| Nicaraguans | 2.0 /100 | #235 | Tragic $92,554 |
| Immigrants | Western Africa | 1.8 /100 | #236 | Tragic $92,384 |
| Immigrants | Bangladesh | 1.7 /100 | #237 | Tragic $92,208 |
| Pennsylvania Germans | 1.5 /100 | #238 | Tragic $91,956 |
| Immigrants | Ecuador | 1.2 /100 | #239 | Tragic $91,462 |
| Immigrants | Burma/Myanmar | 1.1 /100 | #240 | Tragic $91,385 |
| Trinidadians and Tobagonians | 1.1 /100 | #241 | Tragic $91,357 |
| Inupiat | 1.1 /100 | #242 | Tragic $91,355 |
| Immigrants | Trinidad and Tobago | 1.1 /100 | #243 | Tragic $91,347 |
| Immigrants | Middle Africa | 1.1 /100 | #244 | Tragic $91,293 |
| Guyanese | 0.9 /100 | #245 | Tragic $90,966 |
| Central Americans | 0.9 /100 | #246 | Tragic $90,951 |
| Alaskan Athabascans | 0.9 /100 | #247 | Tragic $90,951 |
| Immigrants | Laos | 0.9 /100 | #248 | Tragic $90,909 |
| Mexican American Indians | 0.8 /100 | #249 | Tragic $90,811 |