Immigrants from Indonesia vs Inupiat College, 1 year or more
COMPARE
Immigrants from Indonesia
Inupiat
College, 1 year or more
College, 1 year or more Comparison
Immigrants from Indonesia
Inupiat
63.5%
COLLEGE, 1 YEAR OR MORE
99.5/ 100
METRIC RATING
62nd/ 347
METRIC RANK
47.2%
COLLEGE, 1 YEAR OR MORE
0.0/ 100
METRIC RATING
342nd/ 347
METRIC RANK
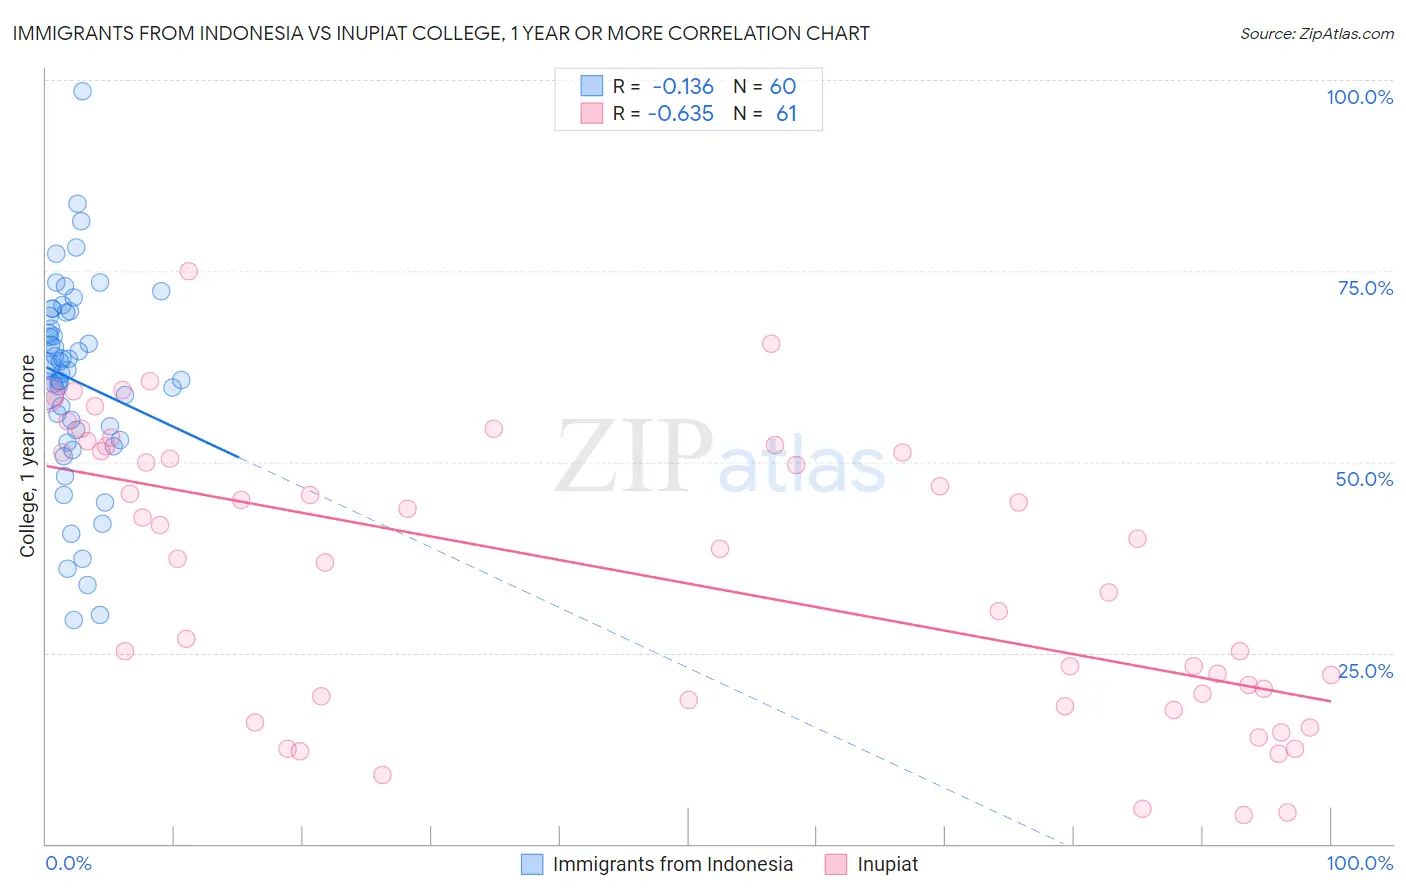
Immigrants from Indonesia vs Inupiat College, 1 year or more Correlation Chart
The statistical analysis conducted on geographies consisting of 215,783,142 people shows a poor negative correlation between the proportion of Immigrants from Indonesia and percentage of population with at least college, 1 year or more education in the United States with a correlation coefficient (R) of -0.136 and weighted average of 63.5%. Similarly, the statistical analysis conducted on geographies consisting of 96,349,094 people shows a significant negative correlation between the proportion of Inupiat and percentage of population with at least college, 1 year or more education in the United States with a correlation coefficient (R) of -0.635 and weighted average of 47.2%, a difference of 34.5%.
College, 1 year or more Correlation Summary
| Measurement | Immigrants from Indonesia | Inupiat |
| Minimum | 29.3% | 3.8% |
| Maximum | 98.6% | 75.0% |
| Range | 69.3% | 71.2% |
| Mean | 60.6% | 35.7% |
| Median | 62.2% | 38.6% |
| Interquartile 25% (IQ1) | 53.6% | 19.1% |
| Interquartile 75% (IQ3) | 69.3% | 51.7% |
| Interquartile Range (IQR) | 15.7% | 32.7% |
| Standard Deviation (Sample) | 13.2% | 18.5% |
| Standard Deviation (Population) | 13.1% | 18.3% |
Similar Demographics by College, 1 year or more
Demographics Similar to Immigrants from Indonesia by College, 1 year or more
In terms of college, 1 year or more, the demographic groups most similar to Immigrants from Indonesia are Bolivian (63.5%, a difference of 0.010%), Immigrants from Kazakhstan (63.6%, a difference of 0.12%), Immigrants from Scotland (63.4%, a difference of 0.13%), Immigrants from Spain (63.4%, a difference of 0.16%), and Maltese (63.4%, a difference of 0.27%).
| Demographics | Rating | Rank | College, 1 year or more |
| Immigrants | Belarus | 99.7 /100 | #55 | Exceptional 64.1% |
| Immigrants | Czechoslovakia | 99.7 /100 | #56 | Exceptional 64.1% |
| South Africans | 99.7 /100 | #57 | Exceptional 64.1% |
| Immigrants | Asia | 99.7 /100 | #58 | Exceptional 64.0% |
| Immigrants | Serbia | 99.6 /100 | #59 | Exceptional 63.8% |
| Immigrants | Kazakhstan | 99.5 /100 | #60 | Exceptional 63.6% |
| Bolivians | 99.5 /100 | #61 | Exceptional 63.5% |
| Immigrants | Indonesia | 99.5 /100 | #62 | Exceptional 63.5% |
| Immigrants | Scotland | 99.4 /100 | #63 | Exceptional 63.4% |
| Immigrants | Spain | 99.4 /100 | #64 | Exceptional 63.4% |
| Maltese | 99.3 /100 | #65 | Exceptional 63.4% |
| Immigrants | Europe | 99.3 /100 | #66 | Exceptional 63.3% |
| Immigrants | Romania | 99.3 /100 | #67 | Exceptional 63.3% |
| Immigrants | Greece | 99.3 /100 | #68 | Exceptional 63.3% |
| Immigrants | Zimbabwe | 99.3 /100 | #69 | Exceptional 63.3% |
Demographics Similar to Inupiat by College, 1 year or more
In terms of college, 1 year or more, the demographic groups most similar to Inupiat are Tohono O'odham (47.1%, a difference of 0.22%), Immigrants from Mexico (47.5%, a difference of 0.57%), Immigrants from Cabo Verde (48.1%, a difference of 1.8%), Yakama (46.2%, a difference of 2.2%), and Immigrants from the Azores (48.4%, a difference of 2.4%).
| Demographics | Rating | Rank | College, 1 year or more |
| Immigrants | Dominican Republic | 0.0 /100 | #333 | Tragic 49.1% |
| Lumbee | 0.0 /100 | #334 | Tragic 48.9% |
| Yuman | 0.0 /100 | #335 | Tragic 48.7% |
| Spanish American Indians | 0.0 /100 | #336 | Tragic 48.5% |
| Pennsylvania Germans | 0.0 /100 | #337 | Tragic 48.5% |
| Immigrants | Central America | 0.0 /100 | #338 | Tragic 48.5% |
| Immigrants | Azores | 0.0 /100 | #339 | Tragic 48.4% |
| Immigrants | Cabo Verde | 0.0 /100 | #340 | Tragic 48.1% |
| Immigrants | Mexico | 0.0 /100 | #341 | Tragic 47.5% |
| Inupiat | 0.0 /100 | #342 | Tragic 47.2% |
| Tohono O'odham | 0.0 /100 | #343 | Tragic 47.1% |
| Yakama | 0.0 /100 | #344 | Tragic 46.2% |
| Pima | 0.0 /100 | #345 | Tragic 45.6% |
| Houma | 0.0 /100 | #346 | Tragic 41.2% |
| Yup'ik | 0.0 /100 | #347 | Tragic 39.4% |