Swedish vs Immigrants from Laos Doctorate Degree
COMPARE
Swedish
Immigrants from Laos
Doctorate Degree
Doctorate Degree Comparison
Swedes
Immigrants from Laos
2.0%
DOCTORATE DEGREE
88.3/ 100
METRIC RATING
136th/ 347
METRIC RANK
1.4%
DOCTORATE DEGREE
0.1/ 100
METRIC RATING
308th/ 347
METRIC RANK
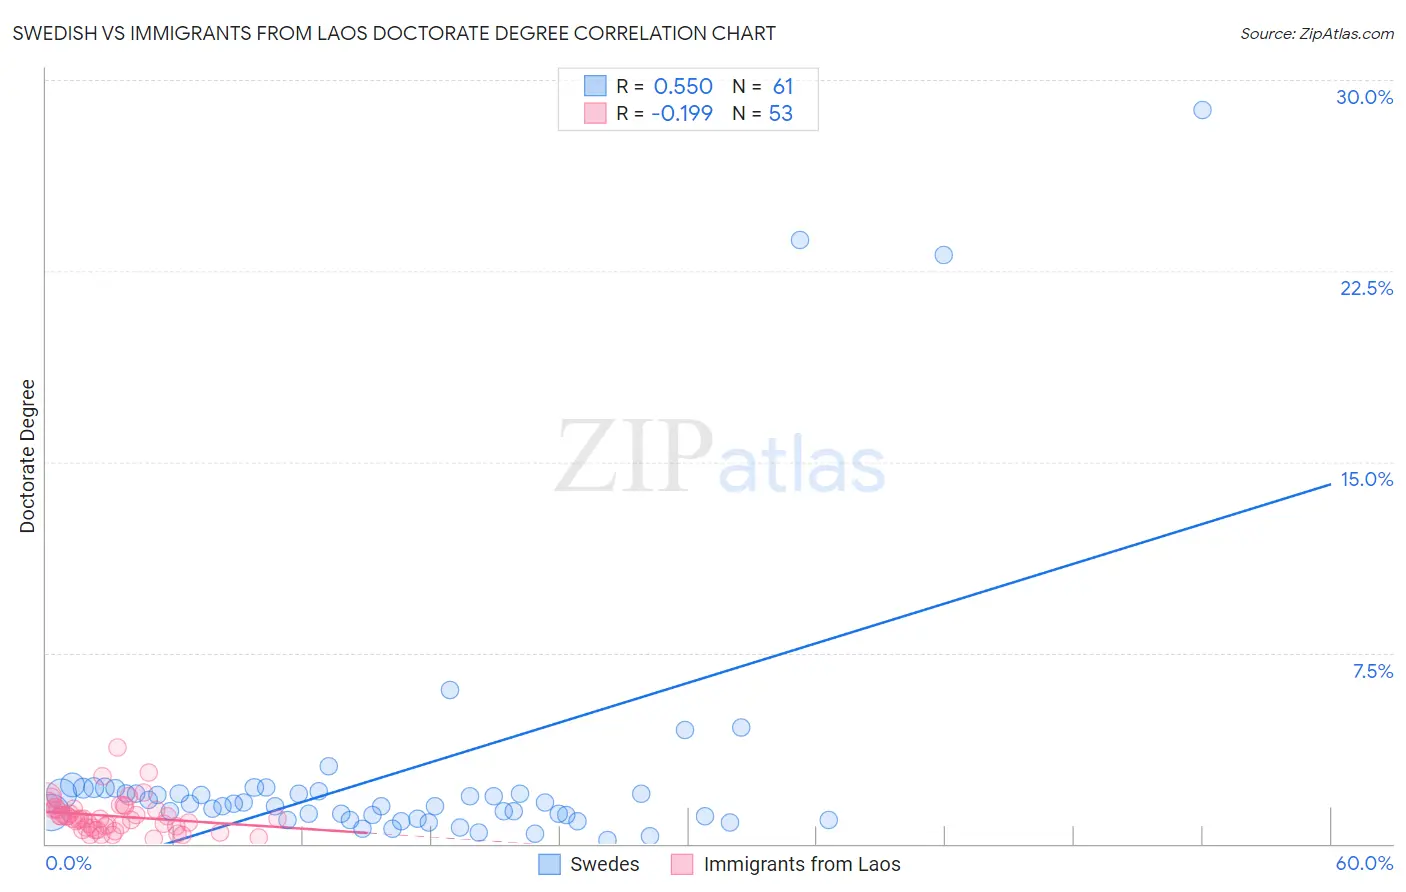
Swedish vs Immigrants from Laos Doctorate Degree Correlation Chart
The statistical analysis conducted on geographies consisting of 521,864,669 people shows a substantial positive correlation between the proportion of Swedes and percentage of population with at least doctorate degree education in the United States with a correlation coefficient (R) of 0.550 and weighted average of 2.0%. Similarly, the statistical analysis conducted on geographies consisting of 200,482,890 people shows a poor negative correlation between the proportion of Immigrants from Laos and percentage of population with at least doctorate degree education in the United States with a correlation coefficient (R) of -0.199 and weighted average of 1.4%, a difference of 43.5%.
Doctorate Degree Correlation Summary
| Measurement | Swedish | Immigrants from Laos |
| Minimum | 0.16% | 0.18% |
| Maximum | 28.8% | 3.8% |
| Range | 28.6% | 3.6% |
| Mean | 2.8% | 1.1% |
| Median | 1.6% | 1.00% |
| Interquartile 25% (IQ1) | 1.0% | 0.64% |
| Interquartile 75% (IQ3) | 2.0% | 1.4% |
| Interquartile Range (IQR) | 0.98% | 0.72% |
| Standard Deviation (Sample) | 5.3% | 0.67% |
| Standard Deviation (Population) | 5.2% | 0.67% |
Similar Demographics by Doctorate Degree
Demographics Similar to Swedes by Doctorate Degree
In terms of doctorate degree, the demographic groups most similar to Swedes are South American Indian (2.0%, a difference of 0.0%), Swiss (2.0%, a difference of 0.10%), Serbian (2.0%, a difference of 0.14%), Immigrants from Cameroon (2.0%, a difference of 0.21%), and Afghan (2.0%, a difference of 0.32%).
| Demographics | Rating | Rank | Doctorate Degree |
| Canadians | 90.6 /100 | #129 | Exceptional 2.0% |
| Immigrants | Ukraine | 90.5 /100 | #130 | Exceptional 2.0% |
| Immigrants | Sierra Leone | 90.2 /100 | #131 | Exceptional 2.0% |
| Scottish | 89.4 /100 | #132 | Excellent 2.0% |
| Immigrants | Uzbekistan | 89.3 /100 | #133 | Excellent 2.0% |
| Immigrants | Cameroon | 88.9 /100 | #134 | Excellent 2.0% |
| Serbians | 88.7 /100 | #135 | Excellent 2.0% |
| Swedes | 88.3 /100 | #136 | Excellent 2.0% |
| South American Indians | 88.3 /100 | #137 | Excellent 2.0% |
| Swiss | 88.0 /100 | #138 | Excellent 2.0% |
| Afghans | 87.2 /100 | #139 | Excellent 2.0% |
| Immigrants | Africa | 87.0 /100 | #140 | Excellent 2.0% |
| Senegalese | 86.7 /100 | #141 | Excellent 2.0% |
| Italians | 86.0 /100 | #142 | Excellent 2.0% |
| Sierra Leoneans | 85.1 /100 | #143 | Excellent 2.0% |
Demographics Similar to Immigrants from Laos by Doctorate Degree
In terms of doctorate degree, the demographic groups most similar to Immigrants from Laos are Cuban (1.4%, a difference of 0.050%), Guyanese (1.4%, a difference of 0.30%), Pennsylvania German (1.4%, a difference of 0.31%), Immigrants from Grenada (1.4%, a difference of 0.41%), and Mexican American Indian (1.4%, a difference of 0.45%).
| Demographics | Rating | Rank | Doctorate Degree |
| Hondurans | 0.1 /100 | #301 | Tragic 1.4% |
| Shoshone | 0.1 /100 | #302 | Tragic 1.4% |
| Immigrants | Dominica | 0.1 /100 | #303 | Tragic 1.4% |
| Mexican American Indians | 0.1 /100 | #304 | Tragic 1.4% |
| Pennsylvania Germans | 0.1 /100 | #305 | Tragic 1.4% |
| Guyanese | 0.1 /100 | #306 | Tragic 1.4% |
| Cubans | 0.1 /100 | #307 | Tragic 1.4% |
| Immigrants | Laos | 0.1 /100 | #308 | Tragic 1.4% |
| Immigrants | Grenada | 0.1 /100 | #309 | Tragic 1.4% |
| Immigrants | Jamaica | 0.1 /100 | #310 | Tragic 1.4% |
| Immigrants | Honduras | 0.1 /100 | #311 | Tragic 1.4% |
| Immigrants | Nicaragua | 0.1 /100 | #312 | Tragic 1.4% |
| Menominee | 0.1 /100 | #313 | Tragic 1.4% |
| Dominicans | 0.1 /100 | #314 | Tragic 1.4% |
| Immigrants | Azores | 0.1 /100 | #315 | Tragic 1.4% |