Swedish vs Immigrants from West Indies Doctorate Degree
COMPARE
Swedish
Immigrants from West Indies
Doctorate Degree
Doctorate Degree Comparison
Swedes
Immigrants from West Indies
2.0%
DOCTORATE DEGREE
88.3/ 100
METRIC RATING
136th/ 347
METRIC RANK
1.5%
DOCTORATE DEGREE
0.9/ 100
METRIC RATING
258th/ 347
METRIC RANK
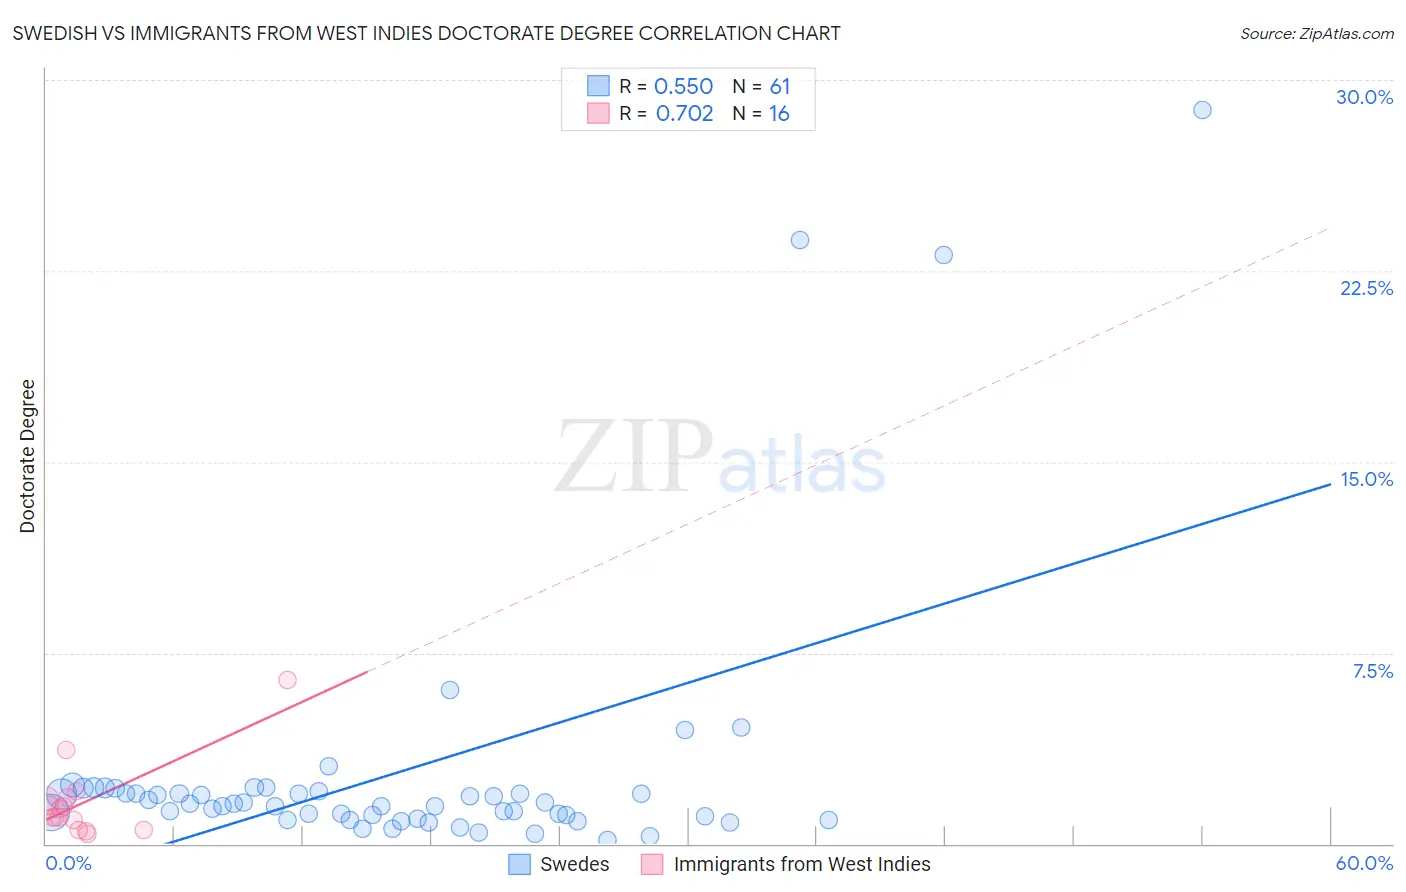
Swedish vs Immigrants from West Indies Doctorate Degree Correlation Chart
The statistical analysis conducted on geographies consisting of 521,864,669 people shows a substantial positive correlation between the proportion of Swedes and percentage of population with at least doctorate degree education in the United States with a correlation coefficient (R) of 0.550 and weighted average of 2.0%. Similarly, the statistical analysis conducted on geographies consisting of 72,397,749 people shows a strong positive correlation between the proportion of Immigrants from West Indies and percentage of population with at least doctorate degree education in the United States with a correlation coefficient (R) of 0.702 and weighted average of 1.5%, a difference of 29.9%.
Doctorate Degree Correlation Summary
| Measurement | Swedish | Immigrants from West Indies |
| Minimum | 0.16% | 0.40% |
| Maximum | 28.8% | 6.4% |
| Range | 28.6% | 6.0% |
| Mean | 2.8% | 1.6% |
| Median | 1.6% | 1.2% |
| Interquartile 25% (IQ1) | 1.0% | 0.74% |
| Interquartile 75% (IQ3) | 2.0% | 1.8% |
| Interquartile Range (IQR) | 0.98% | 1.1% |
| Standard Deviation (Sample) | 5.3% | 1.5% |
| Standard Deviation (Population) | 5.2% | 1.5% |
Similar Demographics by Doctorate Degree
Demographics Similar to Swedes by Doctorate Degree
In terms of doctorate degree, the demographic groups most similar to Swedes are South American Indian (2.0%, a difference of 0.0%), Swiss (2.0%, a difference of 0.10%), Serbian (2.0%, a difference of 0.14%), Immigrants from Cameroon (2.0%, a difference of 0.21%), and Afghan (2.0%, a difference of 0.32%).
| Demographics | Rating | Rank | Doctorate Degree |
| Canadians | 90.6 /100 | #129 | Exceptional 2.0% |
| Immigrants | Ukraine | 90.5 /100 | #130 | Exceptional 2.0% |
| Immigrants | Sierra Leone | 90.2 /100 | #131 | Exceptional 2.0% |
| Scottish | 89.4 /100 | #132 | Excellent 2.0% |
| Immigrants | Uzbekistan | 89.3 /100 | #133 | Excellent 2.0% |
| Immigrants | Cameroon | 88.9 /100 | #134 | Excellent 2.0% |
| Serbians | 88.7 /100 | #135 | Excellent 2.0% |
| Swedes | 88.3 /100 | #136 | Excellent 2.0% |
| South American Indians | 88.3 /100 | #137 | Excellent 2.0% |
| Swiss | 88.0 /100 | #138 | Excellent 2.0% |
| Afghans | 87.2 /100 | #139 | Excellent 2.0% |
| Immigrants | Africa | 87.0 /100 | #140 | Excellent 2.0% |
| Senegalese | 86.7 /100 | #141 | Excellent 2.0% |
| Italians | 86.0 /100 | #142 | Excellent 2.0% |
| Sierra Leoneans | 85.1 /100 | #143 | Excellent 2.0% |
Demographics Similar to Immigrants from West Indies by Doctorate Degree
In terms of doctorate degree, the demographic groups most similar to Immigrants from West Indies are Liberian (1.5%, a difference of 0.030%), Japanese (1.5%, a difference of 0.12%), Chippewa (1.5%, a difference of 0.26%), Central American Indian (1.5%, a difference of 0.48%), and Immigrants from Cambodia (1.5%, a difference of 0.53%).
| Demographics | Rating | Rank | Doctorate Degree |
| Apache | 1.3 /100 | #251 | Tragic 1.5% |
| Yuman | 1.1 /100 | #252 | Tragic 1.5% |
| Americans | 1.0 /100 | #253 | Tragic 1.5% |
| Immigrants | Cambodia | 1.0 /100 | #254 | Tragic 1.5% |
| Trinidadians and Tobagonians | 1.0 /100 | #255 | Tragic 1.5% |
| Central American Indians | 1.0 /100 | #256 | Tragic 1.5% |
| Chippewa | 0.9 /100 | #257 | Tragic 1.5% |
| Immigrants | West Indies | 0.9 /100 | #258 | Tragic 1.5% |
| Liberians | 0.9 /100 | #259 | Tragic 1.5% |
| Japanese | 0.9 /100 | #260 | Tragic 1.5% |
| Immigrants | Portugal | 0.8 /100 | #261 | Tragic 1.5% |
| Chickasaw | 0.7 /100 | #262 | Tragic 1.5% |
| Immigrants | Bahamas | 0.7 /100 | #263 | Tragic 1.5% |
| Blackfeet | 0.7 /100 | #264 | Tragic 1.5% |
| Nicaraguans | 0.6 /100 | #265 | Tragic 1.5% |