Swedish vs Immigrants from Laos Unemployment Among Ages 65 to 74 years
COMPARE
Swedish
Immigrants from Laos
Unemployment Among Ages 65 to 74 years
Unemployment Among Ages 65 to 74 years Comparison
Swedes
Immigrants from Laos
5.1%
UNEMPLOYMENT AMONG AGES 65 TO 74 YEARS
99.5/ 100
METRIC RATING
56th/ 347
METRIC RANK
5.3%
UNEMPLOYMENT AMONG AGES 65 TO 74 YEARS
78.6/ 100
METRIC RATING
140th/ 347
METRIC RANK
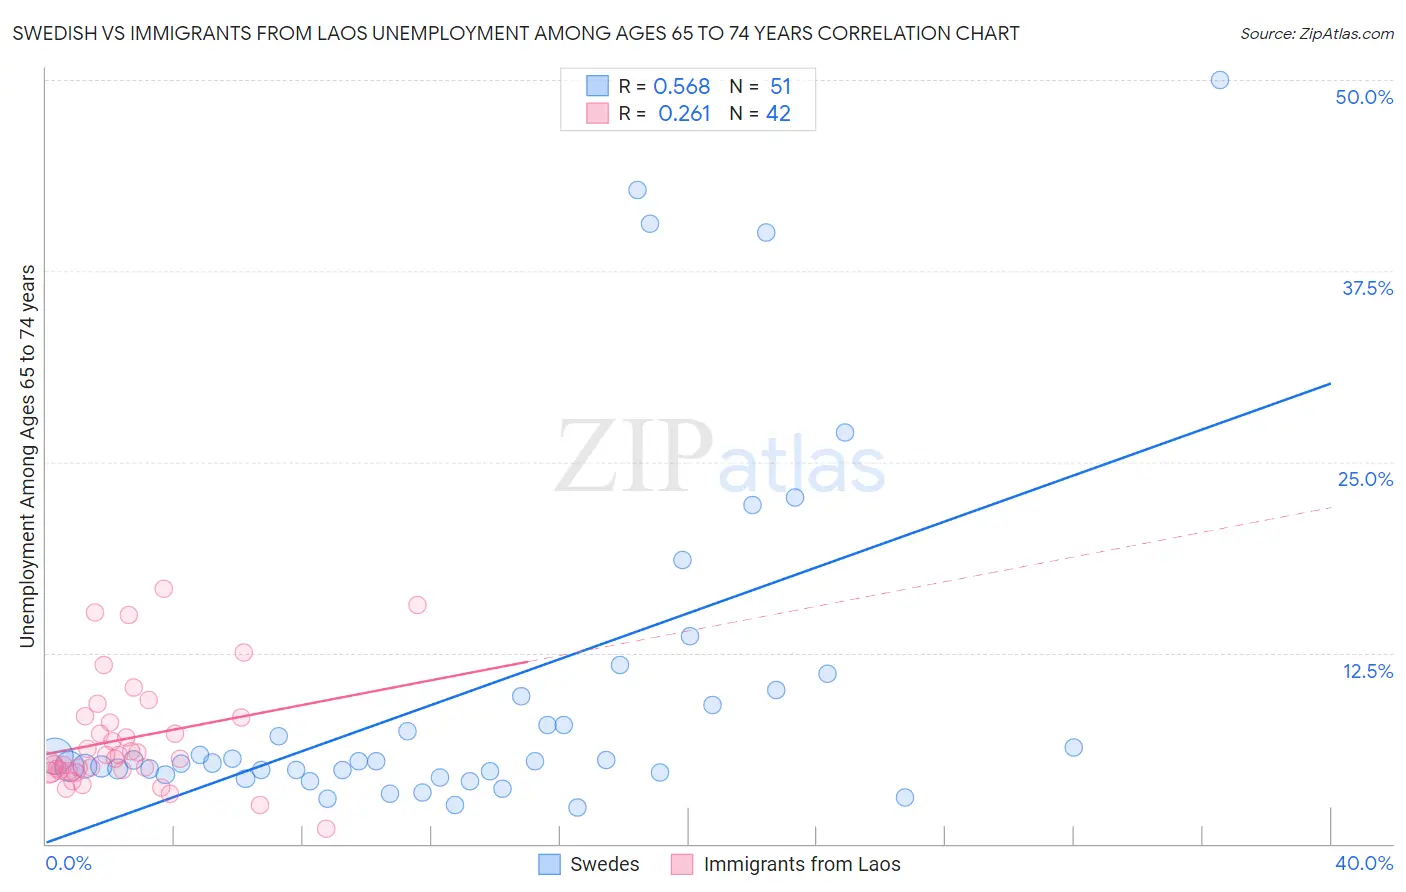
Swedish vs Immigrants from Laos Unemployment Among Ages 65 to 74 years Correlation Chart
The statistical analysis conducted on geographies consisting of 430,257,048 people shows a substantial positive correlation between the proportion of Swedes and unemployment rate among population between the ages 65 and 74 in the United States with a correlation coefficient (R) of 0.568 and weighted average of 5.1%. Similarly, the statistical analysis conducted on geographies consisting of 185,730,778 people shows a weak positive correlation between the proportion of Immigrants from Laos and unemployment rate among population between the ages 65 and 74 in the United States with a correlation coefficient (R) of 0.261 and weighted average of 5.3%, a difference of 3.5%.
Unemployment Among Ages 65 to 74 years Correlation Summary
| Measurement | Swedish | Immigrants from Laos |
| Minimum | 2.3% | 1.0% |
| Maximum | 50.0% | 16.7% |
| Range | 47.7% | 15.7% |
| Mean | 10.0% | 6.9% |
| Median | 5.4% | 5.7% |
| Interquartile 25% (IQ1) | 4.7% | 4.8% |
| Interquartile 75% (IQ3) | 9.7% | 8.3% |
| Interquartile Range (IQR) | 5.0% | 3.5% |
| Standard Deviation (Sample) | 11.1% | 3.7% |
| Standard Deviation (Population) | 11.0% | 3.6% |
Similar Demographics by Unemployment Among Ages 65 to 74 years
Demographics Similar to Swedes by Unemployment Among Ages 65 to 74 years
In terms of unemployment among ages 65 to 74 years, the demographic groups most similar to Swedes are Croatian (5.1%, a difference of 0.0%), German (5.1%, a difference of 0.050%), Carpatho Rusyn (5.1%, a difference of 0.080%), Immigrants from Bulgaria (5.1%, a difference of 0.10%), and Immigrants from Jordan (5.1%, a difference of 0.15%).
| Demographics | Rating | Rank | Unemployment Among Ages 65 to 74 years |
| Immigrants | Austria | 99.8 /100 | #49 | Exceptional 5.1% |
| Immigrants | Zimbabwe | 99.7 /100 | #50 | Exceptional 5.1% |
| Immigrants | Kazakhstan | 99.7 /100 | #51 | Exceptional 5.1% |
| Europeans | 99.6 /100 | #52 | Exceptional 5.1% |
| Immigrants | Ethiopia | 99.6 /100 | #53 | Exceptional 5.1% |
| Immigrants | Nicaragua | 99.6 /100 | #54 | Exceptional 5.1% |
| Carpatho Rusyns | 99.6 /100 | #55 | Exceptional 5.1% |
| Swedes | 99.5 /100 | #56 | Exceptional 5.1% |
| Croatians | 99.5 /100 | #57 | Exceptional 5.1% |
| Germans | 99.5 /100 | #58 | Exceptional 5.1% |
| Immigrants | Bulgaria | 99.4 /100 | #59 | Exceptional 5.1% |
| Immigrants | Jordan | 99.4 /100 | #60 | Exceptional 5.1% |
| Immigrants | Taiwan | 99.4 /100 | #61 | Exceptional 5.1% |
| Nicaraguans | 99.4 /100 | #62 | Exceptional 5.1% |
| Kiowa | 99.3 /100 | #63 | Exceptional 5.1% |
Demographics Similar to Immigrants from Laos by Unemployment Among Ages 65 to 74 years
In terms of unemployment among ages 65 to 74 years, the demographic groups most similar to Immigrants from Laos are Immigrants from Asia (5.3%, a difference of 0.010%), Finnish (5.3%, a difference of 0.020%), Chilean (5.3%, a difference of 0.060%), Celtic (5.3%, a difference of 0.12%), and Immigrants from Afghanistan (5.3%, a difference of 0.12%).
| Demographics | Rating | Rank | Unemployment Among Ages 65 to 74 years |
| Ukrainians | 82.0 /100 | #133 | Excellent 5.3% |
| Immigrants | Panama | 81.8 /100 | #134 | Excellent 5.3% |
| Immigrants | Serbia | 81.8 /100 | #135 | Excellent 5.3% |
| Celtics | 80.8 /100 | #136 | Excellent 5.3% |
| Immigrants | Afghanistan | 80.8 /100 | #137 | Excellent 5.3% |
| Chileans | 79.7 /100 | #138 | Good 5.3% |
| Finns | 79.0 /100 | #139 | Good 5.3% |
| Immigrants | Laos | 78.6 /100 | #140 | Good 5.3% |
| Immigrants | Asia | 78.4 /100 | #141 | Good 5.3% |
| Turks | 76.2 /100 | #142 | Good 5.3% |
| New Zealanders | 76.1 /100 | #143 | Good 5.3% |
| Immigrants | Chile | 76.0 /100 | #144 | Good 5.3% |
| Canadians | 75.0 /100 | #145 | Good 5.3% |
| Irish | 74.8 /100 | #146 | Good 5.3% |
| Immigrants | Latvia | 74.6 /100 | #147 | Good 5.3% |