Immigrants from Guatemala vs Immigrants from Laos Doctorate Degree
COMPARE
Immigrants from Guatemala
Immigrants from Laos
Doctorate Degree
Doctorate Degree Comparison
Immigrants from Guatemala
Immigrants from Laos
1.4%
DOCTORATE DEGREE
0.1/ 100
METRIC RATING
300th/ 347
METRIC RANK
1.4%
DOCTORATE DEGREE
0.1/ 100
METRIC RATING
308th/ 347
METRIC RANK
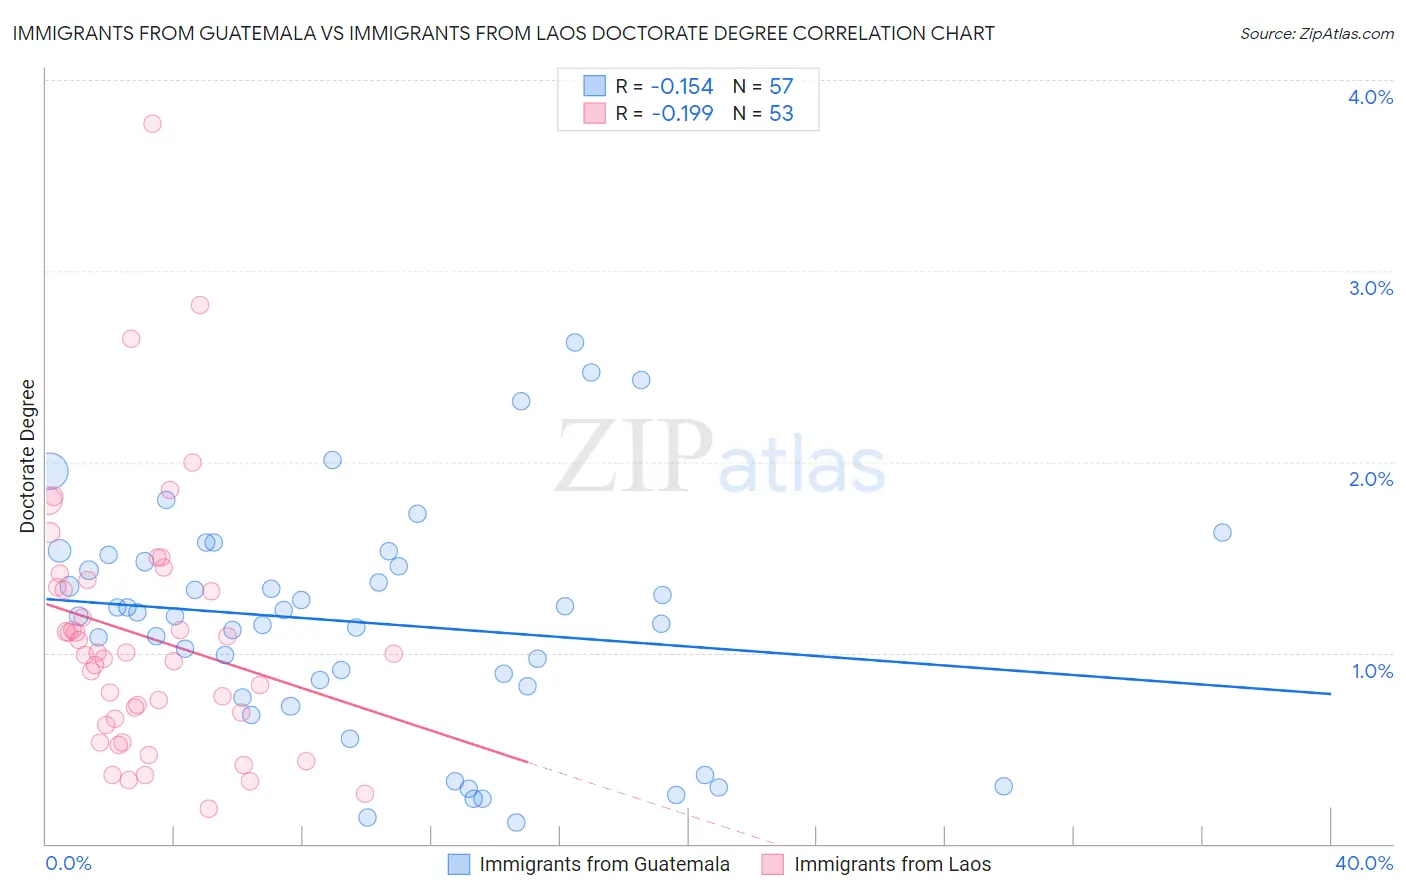
Immigrants from Guatemala vs Immigrants from Laos Doctorate Degree Correlation Chart
The statistical analysis conducted on geographies consisting of 372,323,954 people shows a poor negative correlation between the proportion of Immigrants from Guatemala and percentage of population with at least doctorate degree education in the United States with a correlation coefficient (R) of -0.154 and weighted average of 1.4%. Similarly, the statistical analysis conducted on geographies consisting of 200,482,890 people shows a poor negative correlation between the proportion of Immigrants from Laos and percentage of population with at least doctorate degree education in the United States with a correlation coefficient (R) of -0.199 and weighted average of 1.4%, a difference of 0.93%.
Doctorate Degree Correlation Summary
| Measurement | Immigrants from Guatemala | Immigrants from Laos |
| Minimum | 0.11% | 0.18% |
| Maximum | 2.6% | 3.8% |
| Range | 2.5% | 3.6% |
| Mean | 1.2% | 1.1% |
| Median | 1.2% | 1.00% |
| Interquartile 25% (IQ1) | 0.80% | 0.64% |
| Interquartile 75% (IQ3) | 1.5% | 1.4% |
| Interquartile Range (IQR) | 0.70% | 0.72% |
| Standard Deviation (Sample) | 0.60% | 0.67% |
| Standard Deviation (Population) | 0.59% | 0.67% |
Demographics Similar to Immigrants from Guatemala and Immigrants from Laos by Doctorate Degree
In terms of doctorate degree, the demographic groups most similar to Immigrants from Guatemala are Honduran (1.4%, a difference of 0.070%), Belizean (1.4%, a difference of 0.33%), Shoshone (1.4%, a difference of 0.40%), Immigrants from Dominica (1.4%, a difference of 0.42%), and Mexican American Indian (1.4%, a difference of 0.48%). Similarly, the demographic groups most similar to Immigrants from Laos are Cuban (1.4%, a difference of 0.050%), Guyanese (1.4%, a difference of 0.30%), Pennsylvania German (1.4%, a difference of 0.31%), Immigrants from Grenada (1.4%, a difference of 0.41%), and Mexican American Indian (1.4%, a difference of 0.45%).
| Demographics | Rating | Rank | Doctorate Degree |
| Samoans | 0.2 /100 | #294 | Tragic 1.4% |
| Guatemalans | 0.2 /100 | #295 | Tragic 1.4% |
| Immigrants | Ecuador | 0.2 /100 | #296 | Tragic 1.4% |
| Tsimshian | 0.2 /100 | #297 | Tragic 1.4% |
| Puerto Ricans | 0.1 /100 | #298 | Tragic 1.4% |
| Belizeans | 0.1 /100 | #299 | Tragic 1.4% |
| Immigrants | Guatemala | 0.1 /100 | #300 | Tragic 1.4% |
| Hondurans | 0.1 /100 | #301 | Tragic 1.4% |
| Shoshone | 0.1 /100 | #302 | Tragic 1.4% |
| Immigrants | Dominica | 0.1 /100 | #303 | Tragic 1.4% |
| Mexican American Indians | 0.1 /100 | #304 | Tragic 1.4% |
| Pennsylvania Germans | 0.1 /100 | #305 | Tragic 1.4% |
| Guyanese | 0.1 /100 | #306 | Tragic 1.4% |
| Cubans | 0.1 /100 | #307 | Tragic 1.4% |
| Immigrants | Laos | 0.1 /100 | #308 | Tragic 1.4% |
| Immigrants | Grenada | 0.1 /100 | #309 | Tragic 1.4% |
| Immigrants | Jamaica | 0.1 /100 | #310 | Tragic 1.4% |
| Immigrants | Honduras | 0.1 /100 | #311 | Tragic 1.4% |
| Immigrants | Nicaragua | 0.1 /100 | #312 | Tragic 1.4% |
| Menominee | 0.1 /100 | #313 | Tragic 1.4% |
| Dominicans | 0.1 /100 | #314 | Tragic 1.4% |