Swedish vs Immigrants from Singapore Doctorate Degree
COMPARE
Swedish
Immigrants from Singapore
Doctorate Degree
Doctorate Degree Comparison
Swedes
Immigrants from Singapore
2.0%
DOCTORATE DEGREE
88.3/ 100
METRIC RATING
136th/ 347
METRIC RANK
3.7%
DOCTORATE DEGREE
100.0/ 100
METRIC RATING
1st/ 347
METRIC RANK
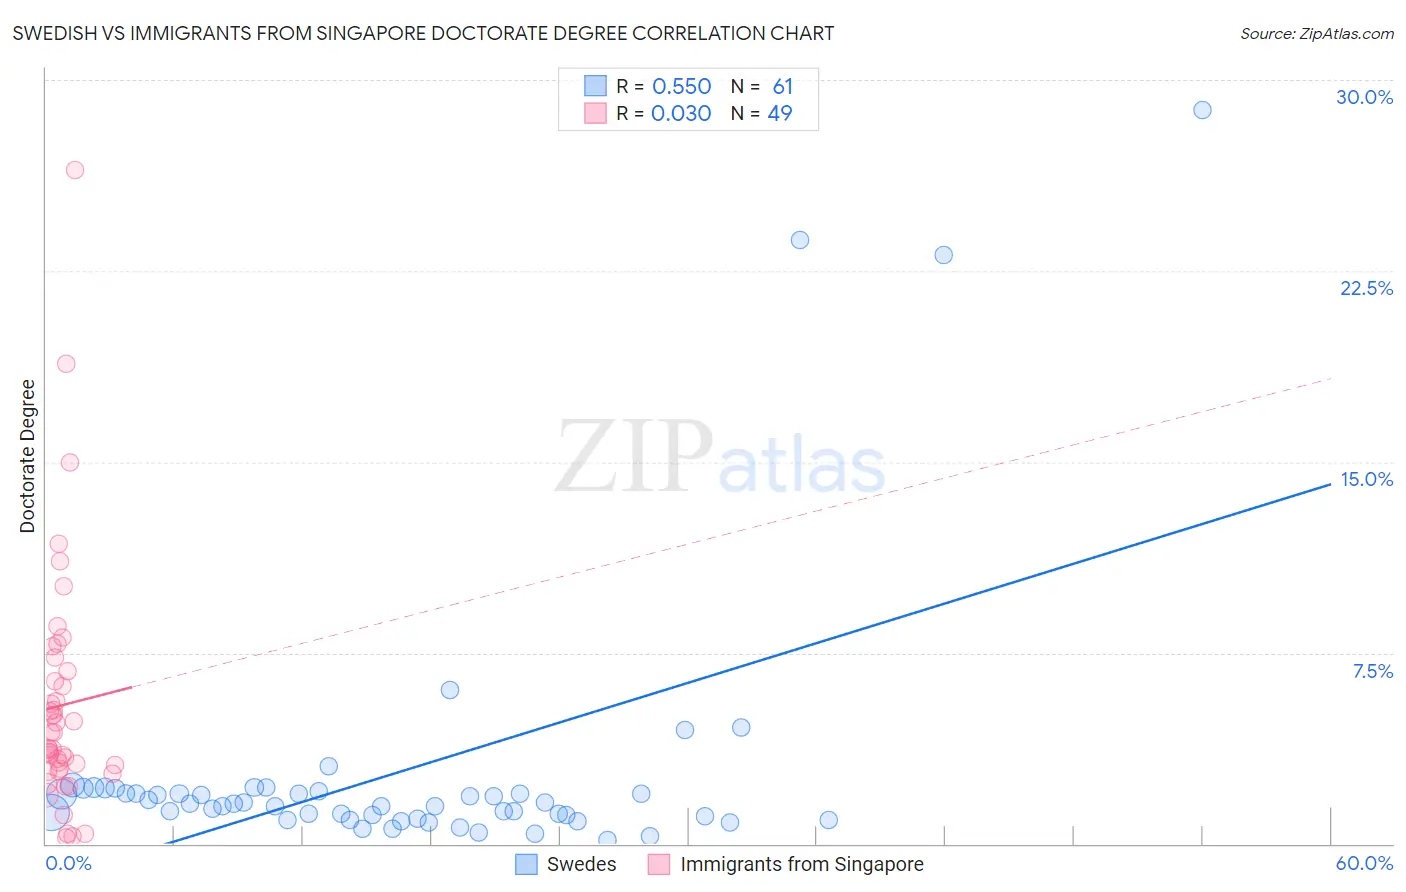
Swedish vs Immigrants from Singapore Doctorate Degree Correlation Chart
The statistical analysis conducted on geographies consisting of 521,864,669 people shows a substantial positive correlation between the proportion of Swedes and percentage of population with at least doctorate degree education in the United States with a correlation coefficient (R) of 0.550 and weighted average of 2.0%. Similarly, the statistical analysis conducted on geographies consisting of 137,317,950 people shows no correlation between the proportion of Immigrants from Singapore and percentage of population with at least doctorate degree education in the United States with a correlation coefficient (R) of 0.030 and weighted average of 3.7%, a difference of 86.4%.
Doctorate Degree Correlation Summary
| Measurement | Swedish | Immigrants from Singapore |
| Minimum | 0.16% | 0.22% |
| Maximum | 28.8% | 26.5% |
| Range | 28.6% | 26.3% |
| Mean | 2.8% | 5.4% |
| Median | 1.6% | 3.7% |
| Interquartile 25% (IQ1) | 1.0% | 2.9% |
| Interquartile 75% (IQ3) | 2.0% | 6.6% |
| Interquartile Range (IQR) | 0.98% | 3.7% |
| Standard Deviation (Sample) | 5.3% | 4.8% |
| Standard Deviation (Population) | 5.2% | 4.7% |
Similar Demographics by Doctorate Degree
Demographics Similar to Swedes by Doctorate Degree
In terms of doctorate degree, the demographic groups most similar to Swedes are South American Indian (2.0%, a difference of 0.0%), Swiss (2.0%, a difference of 0.10%), Serbian (2.0%, a difference of 0.14%), Immigrants from Cameroon (2.0%, a difference of 0.21%), and Afghan (2.0%, a difference of 0.32%).
| Demographics | Rating | Rank | Doctorate Degree |
| Canadians | 90.6 /100 | #129 | Exceptional 2.0% |
| Immigrants | Ukraine | 90.5 /100 | #130 | Exceptional 2.0% |
| Immigrants | Sierra Leone | 90.2 /100 | #131 | Exceptional 2.0% |
| Scottish | 89.4 /100 | #132 | Excellent 2.0% |
| Immigrants | Uzbekistan | 89.3 /100 | #133 | Excellent 2.0% |
| Immigrants | Cameroon | 88.9 /100 | #134 | Excellent 2.0% |
| Serbians | 88.7 /100 | #135 | Excellent 2.0% |
| Swedes | 88.3 /100 | #136 | Excellent 2.0% |
| South American Indians | 88.3 /100 | #137 | Excellent 2.0% |
| Swiss | 88.0 /100 | #138 | Excellent 2.0% |
| Afghans | 87.2 /100 | #139 | Excellent 2.0% |
| Immigrants | Africa | 87.0 /100 | #140 | Excellent 2.0% |
| Senegalese | 86.7 /100 | #141 | Excellent 2.0% |
| Italians | 86.0 /100 | #142 | Excellent 2.0% |
| Sierra Leoneans | 85.1 /100 | #143 | Excellent 2.0% |
Demographics Similar to Immigrants from Singapore by Doctorate Degree
In terms of doctorate degree, the demographic groups most similar to Immigrants from Singapore are Filipino (3.4%, a difference of 7.2%), Okinawan (3.3%, a difference of 12.2%), Immigrants from Taiwan (3.2%, a difference of 15.1%), Iranian (3.1%, a difference of 16.9%), and Immigrants from Switzerland (3.1%, a difference of 19.2%).
| Demographics | Rating | Rank | Doctorate Degree |
| Immigrants | Singapore | 100.0 /100 | #1 | Exceptional 3.7% |
| Filipinos | 100.0 /100 | #2 | Exceptional 3.4% |
| Okinawans | 100.0 /100 | #3 | Exceptional 3.3% |
| Immigrants | Taiwan | 100.0 /100 | #4 | Exceptional 3.2% |
| Iranians | 100.0 /100 | #5 | Exceptional 3.1% |
| Immigrants | Switzerland | 100.0 /100 | #6 | Exceptional 3.1% |
| Immigrants | China | 100.0 /100 | #7 | Exceptional 3.1% |
| Immigrants | Israel | 100.0 /100 | #8 | Exceptional 3.0% |
| Immigrants | Iran | 100.0 /100 | #9 | Exceptional 3.0% |
| Immigrants | Eastern Asia | 100.0 /100 | #10 | Exceptional 3.0% |
| Indians (Asian) | 100.0 /100 | #11 | Exceptional 2.9% |
| Immigrants | Belgium | 100.0 /100 | #12 | Exceptional 2.9% |
| Immigrants | Sweden | 100.0 /100 | #13 | Exceptional 2.9% |
| Immigrants | France | 100.0 /100 | #14 | Exceptional 2.9% |
| Immigrants | India | 100.0 /100 | #15 | Exceptional 2.8% |