Pueblo vs Immigrants from Laos Doctorate Degree
COMPARE
Pueblo
Immigrants from Laos
Doctorate Degree
Doctorate Degree Comparison
Pueblo
Immigrants from Laos
1.7%
DOCTORATE DEGREE
14.2/ 100
METRIC RATING
214th/ 347
METRIC RANK
1.4%
DOCTORATE DEGREE
0.1/ 100
METRIC RATING
308th/ 347
METRIC RANK
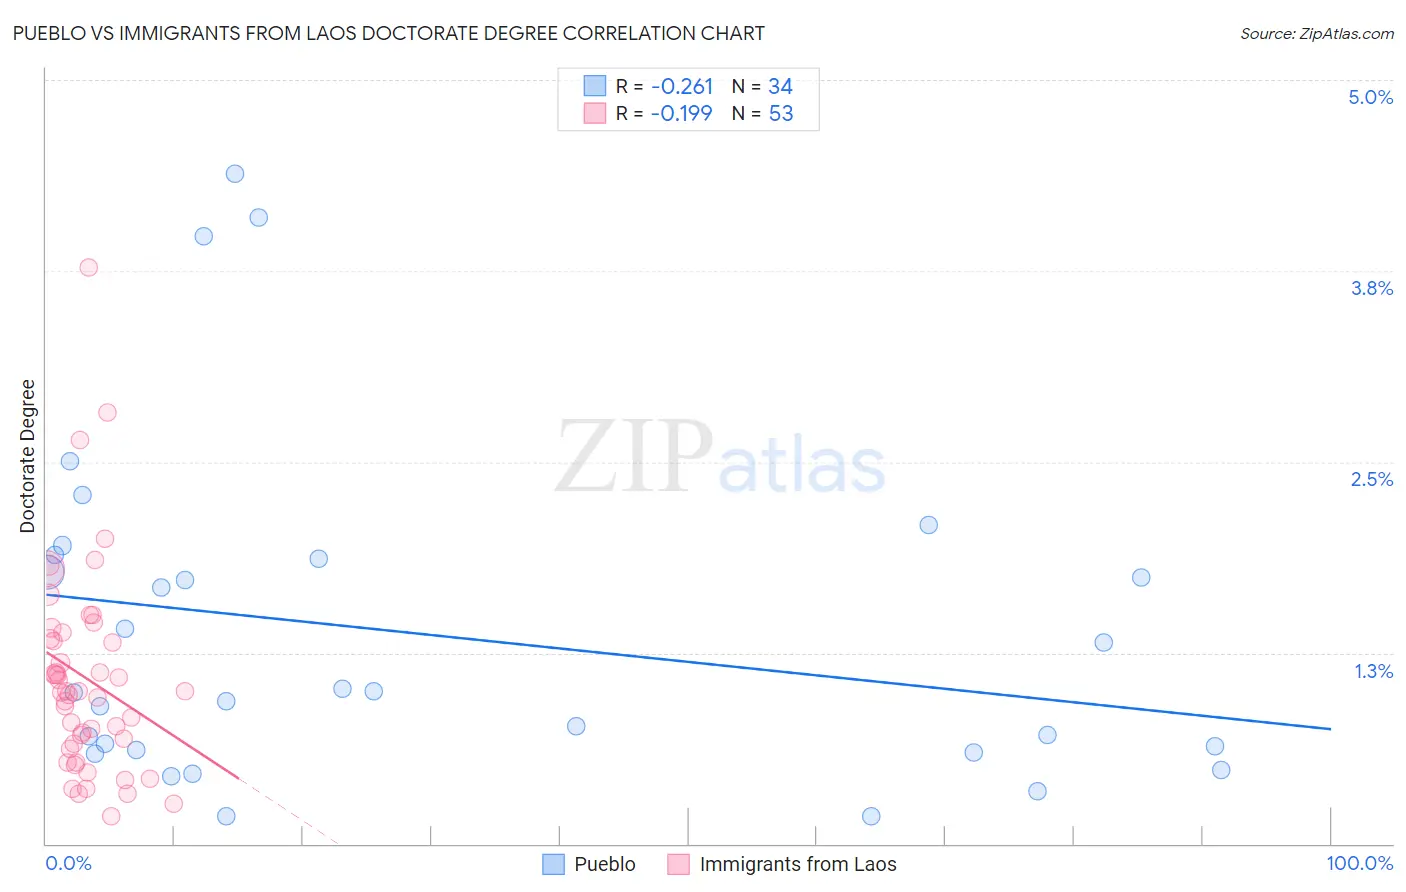
Pueblo vs Immigrants from Laos Doctorate Degree Correlation Chart
The statistical analysis conducted on geographies consisting of 119,278,004 people shows a weak negative correlation between the proportion of Pueblo and percentage of population with at least doctorate degree education in the United States with a correlation coefficient (R) of -0.261 and weighted average of 1.7%. Similarly, the statistical analysis conducted on geographies consisting of 200,482,890 people shows a poor negative correlation between the proportion of Immigrants from Laos and percentage of population with at least doctorate degree education in the United States with a correlation coefficient (R) of -0.199 and weighted average of 1.4%, a difference of 24.8%.
Doctorate Degree Correlation Summary
| Measurement | Pueblo | Immigrants from Laos |
| Minimum | 0.18% | 0.18% |
| Maximum | 4.4% | 3.8% |
| Range | 4.2% | 3.6% |
| Mean | 1.4% | 1.1% |
| Median | 0.99% | 1.00% |
| Interquartile 25% (IQ1) | 0.62% | 0.64% |
| Interquartile 75% (IQ3) | 1.9% | 1.4% |
| Interquartile Range (IQR) | 1.3% | 0.72% |
| Standard Deviation (Sample) | 1.1% | 0.67% |
| Standard Deviation (Population) | 1.1% | 0.67% |
Similar Demographics by Doctorate Degree
Demographics Similar to Pueblo by Doctorate Degree
In terms of doctorate degree, the demographic groups most similar to Pueblo are Korean (1.7%, a difference of 0.010%), Alaskan Athabascan (1.7%, a difference of 0.14%), Immigrants from South Eastern Asia (1.7%, a difference of 0.15%), Immigrants from Burma/Myanmar (1.7%, a difference of 0.24%), and Immigrants from Armenia (1.7%, a difference of 0.28%).
| Demographics | Rating | Rank | Doctorate Degree |
| Yugoslavians | 17.1 /100 | #207 | Poor 1.7% |
| Colombians | 16.1 /100 | #208 | Poor 1.7% |
| Immigrants | Western Africa | 15.4 /100 | #209 | Poor 1.7% |
| Tongans | 15.1 /100 | #210 | Poor 1.7% |
| Immigrants | Armenia | 15.1 /100 | #211 | Poor 1.7% |
| Immigrants | South Eastern Asia | 14.7 /100 | #212 | Poor 1.7% |
| Koreans | 14.2 /100 | #213 | Poor 1.7% |
| Pueblo | 14.2 /100 | #214 | Poor 1.7% |
| Alaskan Athabascans | 13.8 /100 | #215 | Poor 1.7% |
| Immigrants | Burma/Myanmar | 13.5 /100 | #216 | Poor 1.7% |
| Spanish Americans | 12.9 /100 | #217 | Poor 1.7% |
| Tlingit-Haida | 11.9 /100 | #218 | Poor 1.7% |
| Immigrants | Iraq | 10.7 /100 | #219 | Poor 1.7% |
| Immigrants | Uruguay | 9.2 /100 | #220 | Tragic 1.7% |
| Immigrants | Nonimmigrants | 8.8 /100 | #221 | Tragic 1.7% |
Demographics Similar to Immigrants from Laos by Doctorate Degree
In terms of doctorate degree, the demographic groups most similar to Immigrants from Laos are Cuban (1.4%, a difference of 0.050%), Guyanese (1.4%, a difference of 0.30%), Pennsylvania German (1.4%, a difference of 0.31%), Immigrants from Grenada (1.4%, a difference of 0.41%), and Mexican American Indian (1.4%, a difference of 0.45%).
| Demographics | Rating | Rank | Doctorate Degree |
| Hondurans | 0.1 /100 | #301 | Tragic 1.4% |
| Shoshone | 0.1 /100 | #302 | Tragic 1.4% |
| Immigrants | Dominica | 0.1 /100 | #303 | Tragic 1.4% |
| Mexican American Indians | 0.1 /100 | #304 | Tragic 1.4% |
| Pennsylvania Germans | 0.1 /100 | #305 | Tragic 1.4% |
| Guyanese | 0.1 /100 | #306 | Tragic 1.4% |
| Cubans | 0.1 /100 | #307 | Tragic 1.4% |
| Immigrants | Laos | 0.1 /100 | #308 | Tragic 1.4% |
| Immigrants | Grenada | 0.1 /100 | #309 | Tragic 1.4% |
| Immigrants | Jamaica | 0.1 /100 | #310 | Tragic 1.4% |
| Immigrants | Honduras | 0.1 /100 | #311 | Tragic 1.4% |
| Immigrants | Nicaragua | 0.1 /100 | #312 | Tragic 1.4% |
| Menominee | 0.1 /100 | #313 | Tragic 1.4% |
| Dominicans | 0.1 /100 | #314 | Tragic 1.4% |
| Immigrants | Azores | 0.1 /100 | #315 | Tragic 1.4% |