Swedish vs Immigrants from Jordan Doctorate Degree
COMPARE
Swedish
Immigrants from Jordan
Doctorate Degree
Doctorate Degree Comparison
Swedes
Immigrants from Jordan
2.0%
DOCTORATE DEGREE
88.3/ 100
METRIC RATING
136th/ 347
METRIC RANK
2.0%
DOCTORATE DEGREE
94.8/ 100
METRIC RATING
121st/ 347
METRIC RANK
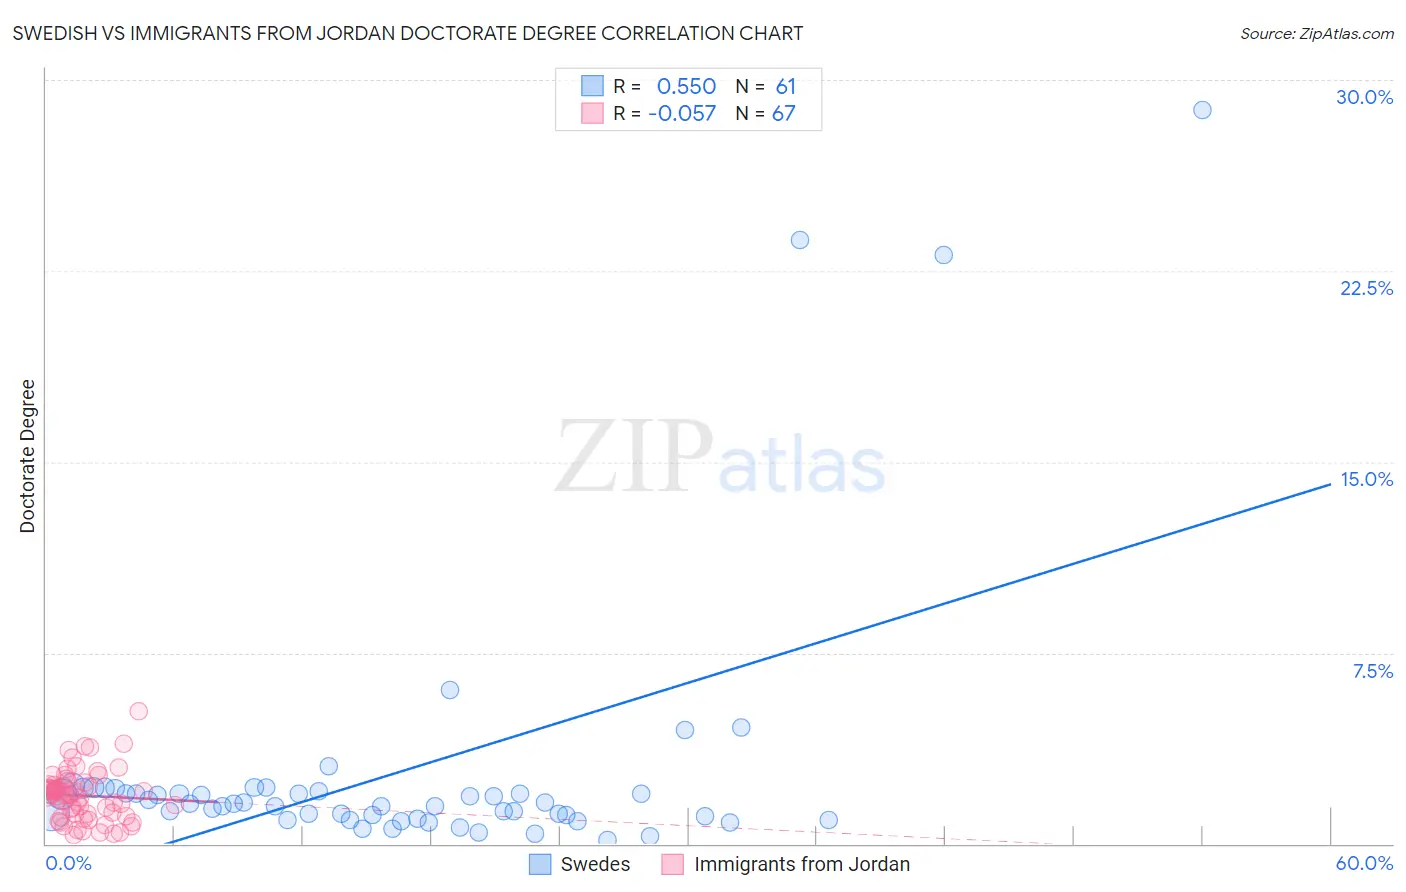
Swedish vs Immigrants from Jordan Doctorate Degree Correlation Chart
The statistical analysis conducted on geographies consisting of 521,864,669 people shows a substantial positive correlation between the proportion of Swedes and percentage of population with at least doctorate degree education in the United States with a correlation coefficient (R) of 0.550 and weighted average of 2.0%. Similarly, the statistical analysis conducted on geographies consisting of 180,883,250 people shows a slight negative correlation between the proportion of Immigrants from Jordan and percentage of population with at least doctorate degree education in the United States with a correlation coefficient (R) of -0.057 and weighted average of 2.0%, a difference of 3.0%.
Doctorate Degree Correlation Summary
| Measurement | Swedish | Immigrants from Jordan |
| Minimum | 0.16% | 0.32% |
| Maximum | 28.8% | 5.2% |
| Range | 28.6% | 4.9% |
| Mean | 2.8% | 1.9% |
| Median | 1.6% | 1.9% |
| Interquartile 25% (IQ1) | 1.0% | 1.2% |
| Interquartile 75% (IQ3) | 2.0% | 2.3% |
| Interquartile Range (IQR) | 0.98% | 1.1% |
| Standard Deviation (Sample) | 5.3% | 0.98% |
| Standard Deviation (Population) | 5.2% | 0.97% |
Demographics Similar to Swedes and Immigrants from Jordan by Doctorate Degree
In terms of doctorate degree, the demographic groups most similar to Swedes are South American Indian (2.0%, a difference of 0.0%), Swiss (2.0%, a difference of 0.10%), Serbian (2.0%, a difference of 0.14%), Immigrants from Cameroon (2.0%, a difference of 0.21%), and Immigrants from Uzbekistan (2.0%, a difference of 0.36%). Similarly, the demographic groups most similar to Immigrants from Jordan are Immigrants from Southern Europe (2.0%, a difference of 0.030%), Immigrants from Morocco (2.0%, a difference of 0.48%), Croatian (2.0%, a difference of 0.48%), Pakistani (2.0%, a difference of 0.76%), and Icelander (2.1%, a difference of 0.90%).
| Demographics | Rating | Rank | Doctorate Degree |
| Icelanders | 96.0 /100 | #118 | Exceptional 2.1% |
| Pakistanis | 95.8 /100 | #119 | Exceptional 2.0% |
| Immigrants | Morocco | 95.5 /100 | #120 | Exceptional 2.0% |
| Immigrants | Jordan | 94.8 /100 | #121 | Exceptional 2.0% |
| Immigrants | Southern Europe | 94.7 /100 | #122 | Exceptional 2.0% |
| Croatians | 94.0 /100 | #123 | Exceptional 2.0% |
| Ute | 93.2 /100 | #124 | Exceptional 2.0% |
| Moroccans | 93.0 /100 | #125 | Exceptional 2.0% |
| Jordanians | 92.1 /100 | #126 | Exceptional 2.0% |
| Palestinians | 92.0 /100 | #127 | Exceptional 2.0% |
| Immigrants | Zaire | 91.1 /100 | #128 | Exceptional 2.0% |
| Canadians | 90.6 /100 | #129 | Exceptional 2.0% |
| Immigrants | Ukraine | 90.5 /100 | #130 | Exceptional 2.0% |
| Immigrants | Sierra Leone | 90.2 /100 | #131 | Exceptional 2.0% |
| Scottish | 89.4 /100 | #132 | Excellent 2.0% |
| Immigrants | Uzbekistan | 89.3 /100 | #133 | Excellent 2.0% |
| Immigrants | Cameroon | 88.9 /100 | #134 | Excellent 2.0% |
| Serbians | 88.7 /100 | #135 | Excellent 2.0% |
| Swedes | 88.3 /100 | #136 | Excellent 2.0% |
| South American Indians | 88.3 /100 | #137 | Excellent 2.0% |
| Swiss | 88.0 /100 | #138 | Excellent 2.0% |