Sudanese vs Immigrants from Moldova 6th Grade
COMPARE
Sudanese
Immigrants from Moldova
6th Grade
6th Grade Comparison
Sudanese
Immigrants from Moldova
96.8%
6TH GRADE
13.9/ 100
METRIC RATING
203rd/ 347
METRIC RANK
97.3%
6TH GRADE
90.0/ 100
METRIC RATING
133rd/ 347
METRIC RANK
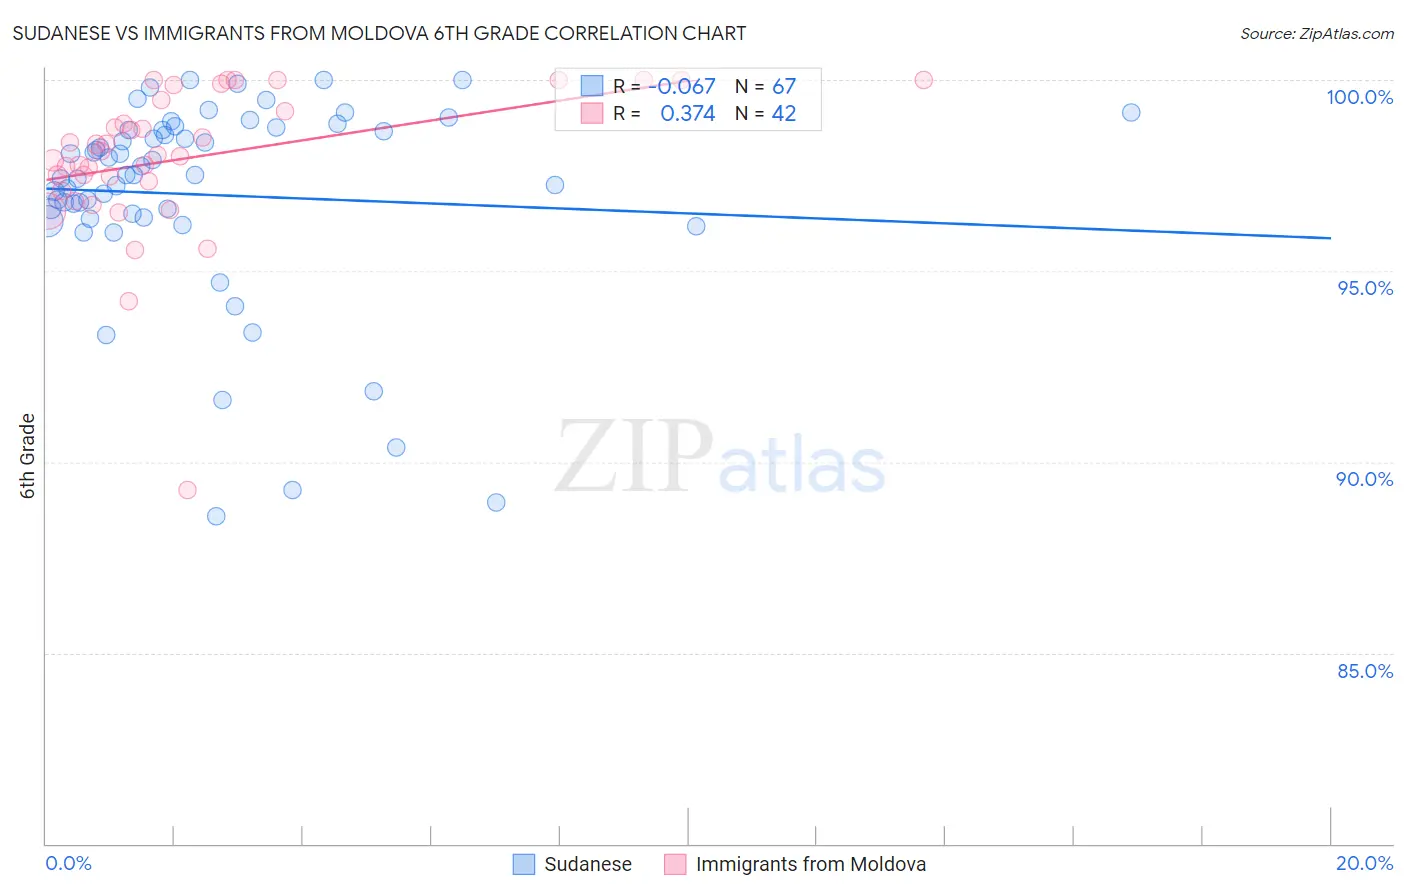
Sudanese vs Immigrants from Moldova 6th Grade Correlation Chart
The statistical analysis conducted on geographies consisting of 110,114,612 people shows a slight negative correlation between the proportion of Sudanese and percentage of population with at least 6th grade education in the United States with a correlation coefficient (R) of -0.067 and weighted average of 96.8%. Similarly, the statistical analysis conducted on geographies consisting of 124,396,843 people shows a mild positive correlation between the proportion of Immigrants from Moldova and percentage of population with at least 6th grade education in the United States with a correlation coefficient (R) of 0.374 and weighted average of 97.3%, a difference of 0.46%.
6th Grade Correlation Summary
| Measurement | Sudanese | Immigrants from Moldova |
| Minimum | 88.6% | 89.3% |
| Maximum | 100.0% | 100.0% |
| Range | 11.4% | 10.7% |
| Mean | 97.0% | 98.0% |
| Median | 97.5% | 98.1% |
| Interquartile 25% (IQ1) | 96.4% | 97.3% |
| Interquartile 75% (IQ3) | 98.7% | 99.5% |
| Interquartile Range (IQR) | 2.3% | 2.2% |
| Standard Deviation (Sample) | 2.6% | 2.0% |
| Standard Deviation (Population) | 2.6% | 2.0% |
Similar Demographics by 6th Grade
Demographics Similar to Sudanese by 6th Grade
In terms of 6th grade, the demographic groups most similar to Sudanese are Immigrants from Chile (96.8%, a difference of 0.0%), Immigrants from Bahamas (96.8%, a difference of 0.0%), African (96.9%, a difference of 0.010%), Immigrants from Zaire (96.9%, a difference of 0.010%), and Native/Alaskan (96.8%, a difference of 0.010%).
| Demographics | Rating | Rank | 6th Grade |
| Immigrants | Uganda | 21.2 /100 | #196 | Fair 96.9% |
| Brazilians | 20.1 /100 | #197 | Fair 96.9% |
| Immigrants | Albania | 18.8 /100 | #198 | Poor 96.9% |
| Immigrants | Northern Africa | 15.7 /100 | #199 | Poor 96.9% |
| Africans | 14.8 /100 | #200 | Poor 96.9% |
| Immigrants | Zaire | 14.5 /100 | #201 | Poor 96.9% |
| Immigrants | Chile | 14.2 /100 | #202 | Poor 96.8% |
| Sudanese | 13.9 /100 | #203 | Poor 96.8% |
| Immigrants | Bahamas | 13.8 /100 | #204 | Poor 96.8% |
| Natives/Alaskans | 13.0 /100 | #205 | Poor 96.8% |
| Laotians | 11.8 /100 | #206 | Poor 96.8% |
| Iraqis | 11.7 /100 | #207 | Poor 96.8% |
| Samoans | 11.0 /100 | #208 | Poor 96.8% |
| Immigrants | Oceania | 11.0 /100 | #209 | Poor 96.8% |
| Immigrants | Nepal | 10.1 /100 | #210 | Poor 96.8% |
Demographics Similar to Immigrants from Moldova by 6th Grade
In terms of 6th grade, the demographic groups most similar to Immigrants from Moldova are Immigrants from Europe (97.3%, a difference of 0.010%), Palestinian (97.3%, a difference of 0.010%), Immigrants from Kuwait (97.3%, a difference of 0.010%), Immigrants from Hungary (97.3%, a difference of 0.010%), and Filipino (97.3%, a difference of 0.010%).
| Demographics | Rating | Rank | 6th Grade |
| Immigrants | Bulgaria | 93.6 /100 | #126 | Exceptional 97.3% |
| Immigrants | Croatia | 93.1 /100 | #127 | Exceptional 97.3% |
| Immigrants | Romania | 92.0 /100 | #128 | Exceptional 97.3% |
| Immigrants | Serbia | 91.9 /100 | #129 | Exceptional 97.3% |
| Cambodians | 91.8 /100 | #130 | Exceptional 97.3% |
| Immigrants | Europe | 91.1 /100 | #131 | Exceptional 97.3% |
| Palestinians | 90.9 /100 | #132 | Exceptional 97.3% |
| Immigrants | Moldova | 90.0 /100 | #133 | Excellent 97.3% |
| Immigrants | Kuwait | 89.5 /100 | #134 | Excellent 97.3% |
| Immigrants | Hungary | 89.5 /100 | #135 | Excellent 97.3% |
| Filipinos | 88.9 /100 | #136 | Excellent 97.3% |
| Burmese | 87.8 /100 | #137 | Excellent 97.3% |
| Blackfeet | 87.7 /100 | #138 | Excellent 97.3% |
| Immigrants | Turkey | 86.1 /100 | #139 | Excellent 97.3% |
| Immigrants | North Macedonia | 85.5 /100 | #140 | Excellent 97.2% |