Sudanese vs Immigrants from Micronesia 6th Grade
COMPARE
Sudanese
Immigrants from Micronesia
6th Grade
6th Grade Comparison
Sudanese
Immigrants from Micronesia
96.8%
6TH GRADE
13.9/ 100
METRIC RATING
203rd/ 347
METRIC RANK
97.0%
6TH GRADE
47.1/ 100
METRIC RATING
176th/ 347
METRIC RANK
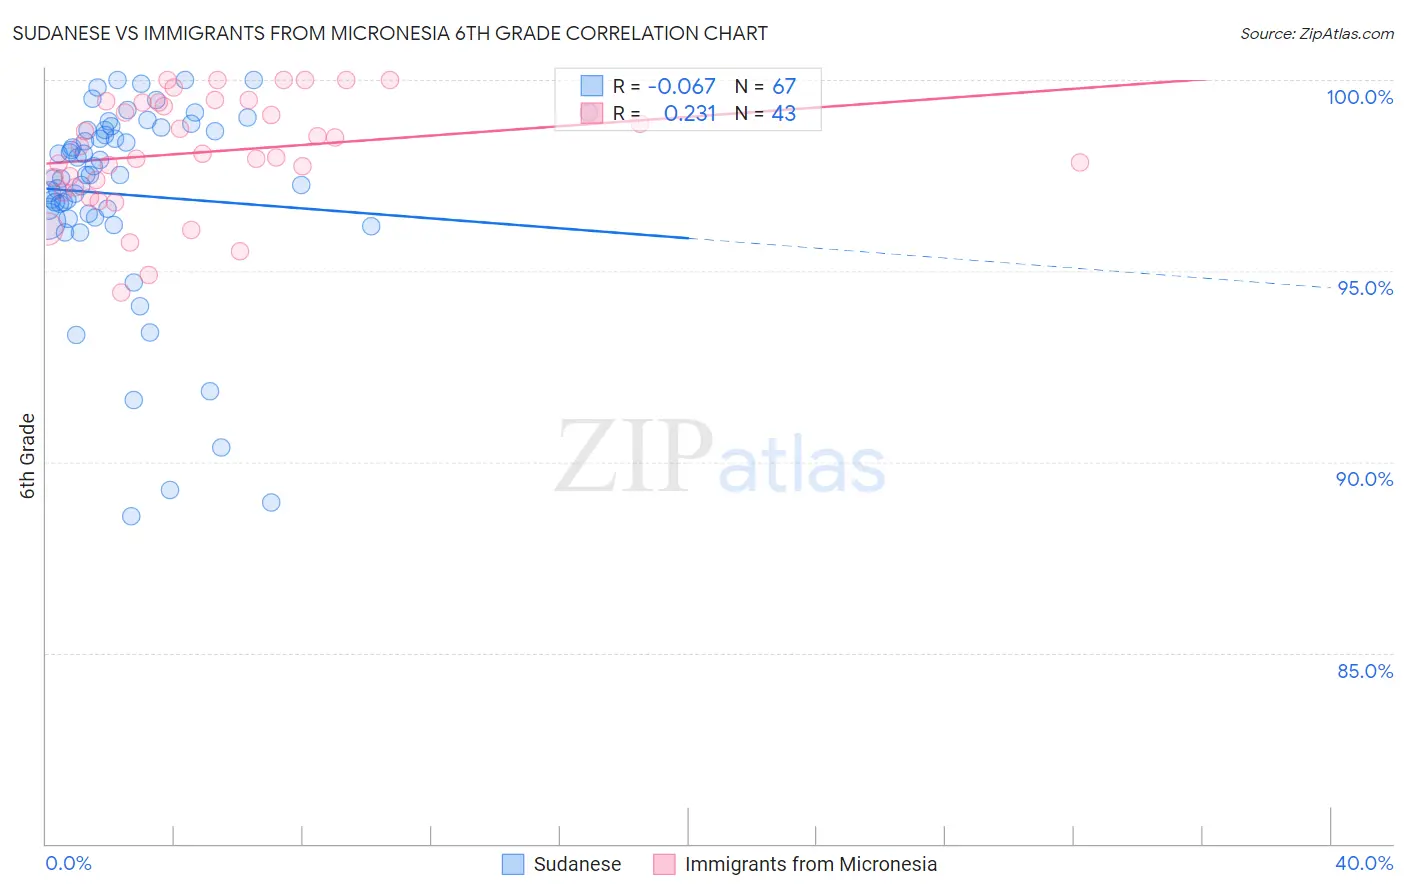
Sudanese vs Immigrants from Micronesia 6th Grade Correlation Chart
The statistical analysis conducted on geographies consisting of 110,114,612 people shows a slight negative correlation between the proportion of Sudanese and percentage of population with at least 6th grade education in the United States with a correlation coefficient (R) of -0.067 and weighted average of 96.8%. Similarly, the statistical analysis conducted on geographies consisting of 61,604,657 people shows a weak positive correlation between the proportion of Immigrants from Micronesia and percentage of population with at least 6th grade education in the United States with a correlation coefficient (R) of 0.231 and weighted average of 97.0%, a difference of 0.20%.
6th Grade Correlation Summary
| Measurement | Sudanese | Immigrants from Micronesia |
| Minimum | 88.6% | 94.4% |
| Maximum | 100.0% | 100.0% |
| Range | 11.4% | 5.6% |
| Mean | 97.0% | 98.1% |
| Median | 97.5% | 98.1% |
| Interquartile 25% (IQ1) | 96.4% | 97.2% |
| Interquartile 75% (IQ3) | 98.7% | 99.4% |
| Interquartile Range (IQR) | 2.3% | 2.2% |
| Standard Deviation (Sample) | 2.6% | 1.5% |
| Standard Deviation (Population) | 2.6% | 1.5% |
Similar Demographics by 6th Grade
Demographics Similar to Sudanese by 6th Grade
In terms of 6th grade, the demographic groups most similar to Sudanese are Immigrants from Chile (96.8%, a difference of 0.0%), Immigrants from Bahamas (96.8%, a difference of 0.0%), African (96.9%, a difference of 0.010%), Immigrants from Zaire (96.9%, a difference of 0.010%), and Native/Alaskan (96.8%, a difference of 0.010%).
| Demographics | Rating | Rank | 6th Grade |
| Immigrants | Uganda | 21.2 /100 | #196 | Fair 96.9% |
| Brazilians | 20.1 /100 | #197 | Fair 96.9% |
| Immigrants | Albania | 18.8 /100 | #198 | Poor 96.9% |
| Immigrants | Northern Africa | 15.7 /100 | #199 | Poor 96.9% |
| Africans | 14.8 /100 | #200 | Poor 96.9% |
| Immigrants | Zaire | 14.5 /100 | #201 | Poor 96.9% |
| Immigrants | Chile | 14.2 /100 | #202 | Poor 96.8% |
| Sudanese | 13.9 /100 | #203 | Poor 96.8% |
| Immigrants | Bahamas | 13.8 /100 | #204 | Poor 96.8% |
| Natives/Alaskans | 13.0 /100 | #205 | Poor 96.8% |
| Laotians | 11.8 /100 | #206 | Poor 96.8% |
| Iraqis | 11.7 /100 | #207 | Poor 96.8% |
| Samoans | 11.0 /100 | #208 | Poor 96.8% |
| Immigrants | Oceania | 11.0 /100 | #209 | Poor 96.8% |
| Immigrants | Nepal | 10.1 /100 | #210 | Poor 96.8% |
Demographics Similar to Immigrants from Micronesia by 6th Grade
In terms of 6th grade, the demographic groups most similar to Immigrants from Micronesia are Immigrants from Kazakhstan (97.0%, a difference of 0.0%), Mongolian (97.0%, a difference of 0.0%), Arab (97.0%, a difference of 0.010%), Venezuelan (97.0%, a difference of 0.010%), and Pakistani (97.0%, a difference of 0.010%).
| Demographics | Rating | Rank | 6th Grade |
| Bermudans | 52.6 /100 | #169 | Average 97.1% |
| Chileans | 52.1 /100 | #170 | Average 97.1% |
| Immigrants | Sri Lanka | 51.7 /100 | #171 | Average 97.1% |
| Egyptians | 50.9 /100 | #172 | Average 97.1% |
| Arabs | 50.1 /100 | #173 | Average 97.0% |
| Venezuelans | 50.0 /100 | #174 | Average 97.0% |
| Immigrants | Kazakhstan | 47.3 /100 | #175 | Average 97.0% |
| Immigrants | Micronesia | 47.1 /100 | #176 | Average 97.0% |
| Mongolians | 46.7 /100 | #177 | Average 97.0% |
| Pakistanis | 46.0 /100 | #178 | Average 97.0% |
| Immigrants | Kenya | 45.3 /100 | #179 | Average 97.0% |
| Immigrants | Spain | 39.9 /100 | #180 | Fair 97.0% |
| Comanche | 37.9 /100 | #181 | Fair 97.0% |
| Immigrants | Ukraine | 35.6 /100 | #182 | Fair 97.0% |
| Immigrants | Venezuela | 34.5 /100 | #183 | Fair 97.0% |