Sudanese vs Immigrants from India 2nd Grade
COMPARE
Sudanese
Immigrants from India
2nd Grade
2nd Grade Comparison
Sudanese
Immigrants from India
97.7%
2ND GRADE
5.7/ 100
METRIC RATING
218th/ 347
METRIC RANK
98.2%
2ND GRADE
98.8/ 100
METRIC RATING
93rd/ 347
METRIC RANK
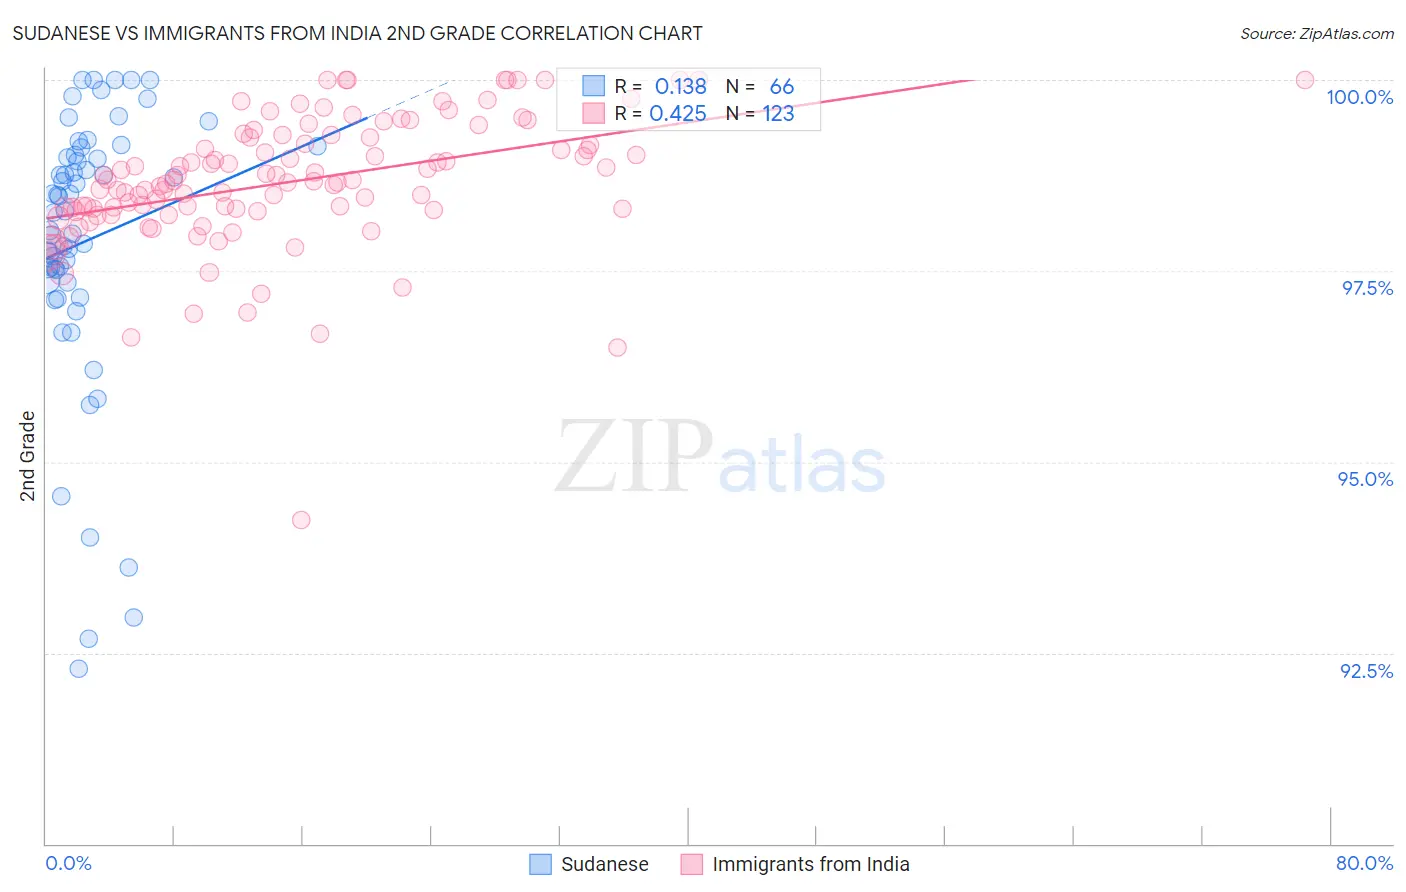
Sudanese vs Immigrants from India 2nd Grade Correlation Chart
The statistical analysis conducted on geographies consisting of 110,135,898 people shows a poor positive correlation between the proportion of Sudanese and percentage of population with at least 2nd grade education in the United States with a correlation coefficient (R) of 0.138 and weighted average of 97.7%. Similarly, the statistical analysis conducted on geographies consisting of 434,105,844 people shows a moderate positive correlation between the proportion of Immigrants from India and percentage of population with at least 2nd grade education in the United States with a correlation coefficient (R) of 0.425 and weighted average of 98.2%, a difference of 0.57%.
2nd Grade Correlation Summary
| Measurement | Sudanese | Immigrants from India |
| Minimum | 92.3% | 94.2% |
| Maximum | 100.0% | 100.0% |
| Range | 7.7% | 5.8% |
| Mean | 97.9% | 98.7% |
| Median | 98.3% | 98.7% |
| Interquartile 25% (IQ1) | 97.4% | 98.3% |
| Interquartile 75% (IQ3) | 99.0% | 99.2% |
| Interquartile Range (IQR) | 1.6% | 0.96% |
| Standard Deviation (Sample) | 1.8% | 0.86% |
| Standard Deviation (Population) | 1.8% | 0.86% |
Similar Demographics by 2nd Grade
Demographics Similar to Sudanese by 2nd Grade
In terms of 2nd grade, the demographic groups most similar to Sudanese are South American Indian (97.7%, a difference of 0.010%), Uruguayan (97.7%, a difference of 0.010%), Immigrants from Panama (97.6%, a difference of 0.010%), Immigrants from Morocco (97.6%, a difference of 0.010%), and Samoan (97.7%, a difference of 0.020%).
| Demographics | Rating | Rank | 2nd Grade |
| Laotians | 9.9 /100 | #211 | Tragic 97.7% |
| Immigrants | Bahamas | 8.4 /100 | #212 | Tragic 97.7% |
| Moroccans | 8.2 /100 | #213 | Tragic 97.7% |
| Samoans | 7.1 /100 | #214 | Tragic 97.7% |
| Bahamians | 6.8 /100 | #215 | Tragic 97.7% |
| South American Indians | 6.7 /100 | #216 | Tragic 97.7% |
| Uruguayans | 6.2 /100 | #217 | Tragic 97.7% |
| Sudanese | 5.7 /100 | #218 | Tragic 97.7% |
| Immigrants | Panama | 5.1 /100 | #219 | Tragic 97.6% |
| Immigrants | Morocco | 5.0 /100 | #220 | Tragic 97.6% |
| Iraqis | 4.6 /100 | #221 | Tragic 97.6% |
| Immigrants | Sudan | 4.5 /100 | #222 | Tragic 97.6% |
| Sierra Leoneans | 4.3 /100 | #223 | Tragic 97.6% |
| Immigrants | Zaire | 4.3 /100 | #224 | Tragic 97.6% |
| Tongans | 4.3 /100 | #225 | Tragic 97.6% |
Demographics Similar to Immigrants from India by 2nd Grade
In terms of 2nd grade, the demographic groups most similar to Immigrants from India are Zimbabwean (98.2%, a difference of 0.0%), Immigrants from Western Europe (98.2%, a difference of 0.0%), Immigrants from South Africa (98.2%, a difference of 0.0%), Macedonian (98.2%, a difference of 0.010%), and Ukrainian (98.2%, a difference of 0.010%).
| Demographics | Rating | Rank | 2nd Grade |
| Immigrants | Australia | 99.0 /100 | #86 | Exceptional 98.2% |
| Immigrants | Denmark | 99.0 /100 | #87 | Exceptional 98.2% |
| Macedonians | 99.0 /100 | #88 | Exceptional 98.2% |
| Ukrainians | 98.9 /100 | #89 | Exceptional 98.2% |
| Zimbabweans | 98.8 /100 | #90 | Exceptional 98.2% |
| Immigrants | Western Europe | 98.8 /100 | #91 | Exceptional 98.2% |
| Immigrants | South Africa | 98.8 /100 | #92 | Exceptional 98.2% |
| Immigrants | India | 98.8 /100 | #93 | Exceptional 98.2% |
| Immigrants | Germany | 98.6 /100 | #94 | Exceptional 98.2% |
| South Africans | 98.6 /100 | #95 | Exceptional 98.2% |
| Cypriots | 98.4 /100 | #96 | Exceptional 98.2% |
| Choctaw | 98.3 /100 | #97 | Exceptional 98.2% |
| Immigrants | Nonimmigrants | 98.3 /100 | #98 | Exceptional 98.2% |
| Immigrants | Ireland | 98.0 /100 | #99 | Exceptional 98.2% |
| Romanians | 98.0 /100 | #100 | Exceptional 98.2% |