Sudanese vs Navajo GED/Equivalency
COMPARE
Sudanese
Navajo
GED/Equivalency
GED/Equivalency Comparison
Sudanese
Navajo
85.5%
GED/EQUIVALENCY
35.2/ 100
METRIC RATING
182nd/ 347
METRIC RANK
81.5%
GED/EQUIVALENCY
0.0/ 100
METRIC RATING
304th/ 347
METRIC RANK
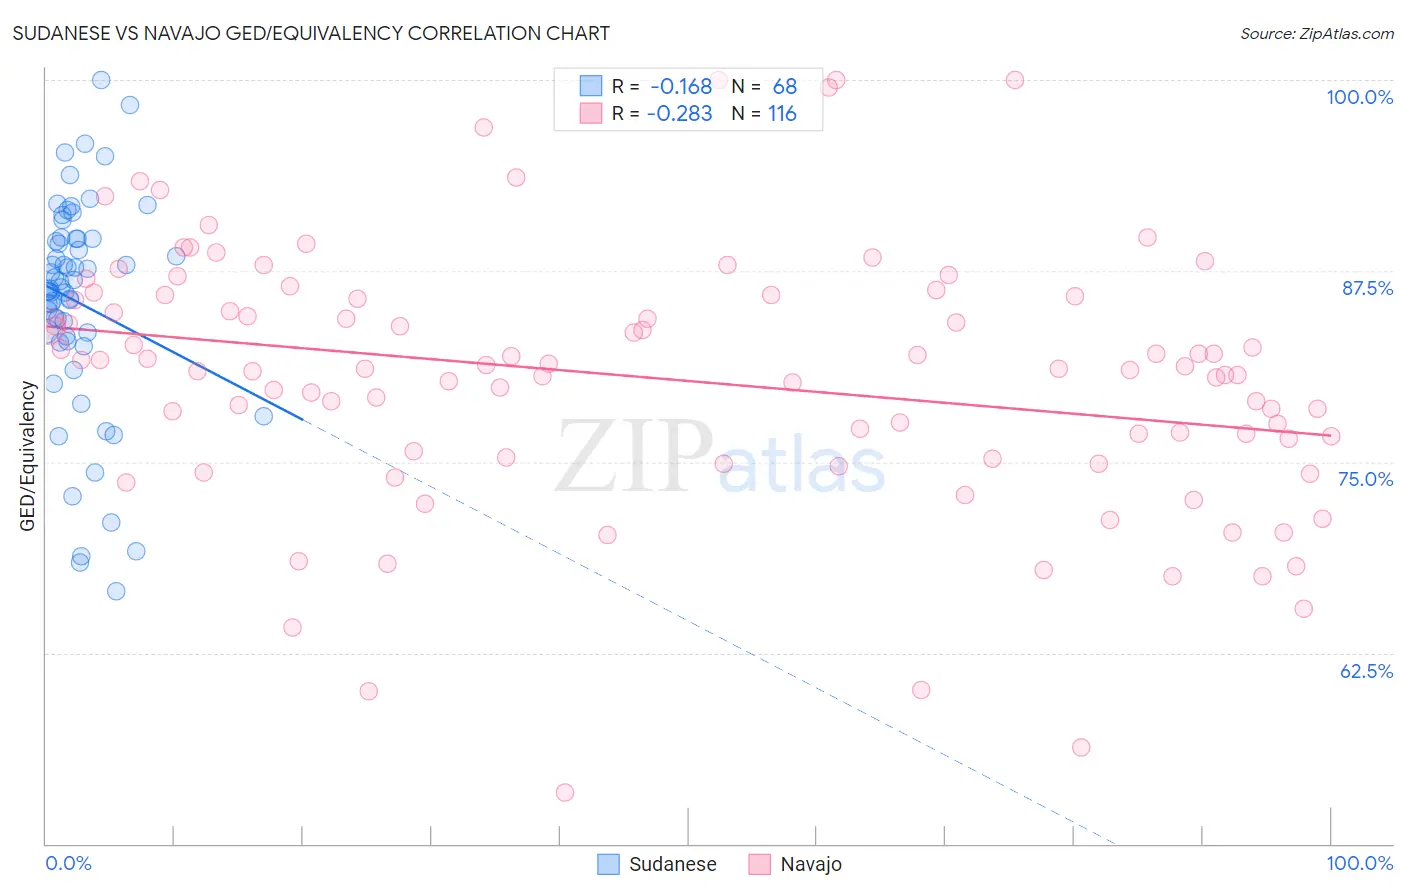
Sudanese vs Navajo GED/Equivalency Correlation Chart
The statistical analysis conducted on geographies consisting of 110,147,806 people shows a poor negative correlation between the proportion of Sudanese and percentage of population with at least ged/equivalency education in the United States with a correlation coefficient (R) of -0.168 and weighted average of 85.5%. Similarly, the statistical analysis conducted on geographies consisting of 224,872,856 people shows a weak negative correlation between the proportion of Navajo and percentage of population with at least ged/equivalency education in the United States with a correlation coefficient (R) of -0.283 and weighted average of 81.5%, a difference of 4.9%.
GED/Equivalency Correlation Summary
| Measurement | Sudanese | Navajo |
| Minimum | 66.5% | 53.3% |
| Maximum | 100.0% | 100.0% |
| Range | 33.5% | 46.7% |
| Mean | 85.4% | 80.4% |
| Median | 86.4% | 81.1% |
| Interquartile 25% (IQ1) | 83.0% | 75.5% |
| Interquartile 75% (IQ3) | 89.6% | 85.8% |
| Interquartile Range (IQR) | 6.5% | 10.3% |
| Standard Deviation (Sample) | 7.0% | 8.6% |
| Standard Deviation (Population) | 7.0% | 8.5% |
Similar Demographics by GED/Equivalency
Demographics Similar to Sudanese by GED/Equivalency
In terms of ged/equivalency, the demographic groups most similar to Sudanese are Immigrants from Sudan (85.5%, a difference of 0.020%), Immigrants from Oceania (85.5%, a difference of 0.040%), Spanish (85.4%, a difference of 0.050%), Moroccan (85.5%, a difference of 0.060%), and Immigrants from Southern Europe (85.5%, a difference of 0.070%).
| Demographics | Rating | Rank | GED/Equivalency |
| Immigrants | Bolivia | 49.8 /100 | #175 | Average 85.8% |
| Immigrants | Eastern Africa | 47.7 /100 | #176 | Average 85.7% |
| Immigrants | Uganda | 45.2 /100 | #177 | Average 85.7% |
| Koreans | 41.2 /100 | #178 | Average 85.6% |
| Aleuts | 40.5 /100 | #179 | Average 85.6% |
| Immigrants | Southern Europe | 38.4 /100 | #180 | Fair 85.5% |
| Moroccans | 37.7 /100 | #181 | Fair 85.5% |
| Sudanese | 35.2 /100 | #182 | Fair 85.5% |
| Immigrants | Sudan | 34.2 /100 | #183 | Fair 85.5% |
| Immigrants | Oceania | 33.6 /100 | #184 | Fair 85.5% |
| Spanish | 32.8 /100 | #185 | Fair 85.4% |
| Spaniards | 31.9 /100 | #186 | Fair 85.4% |
| Immigrants | Afghanistan | 29.8 /100 | #187 | Fair 85.4% |
| Immigrants | Sierra Leone | 29.0 /100 | #188 | Fair 85.4% |
| Guamanians/Chamorros | 28.4 /100 | #189 | Fair 85.3% |
Demographics Similar to Navajo by GED/Equivalency
In terms of ged/equivalency, the demographic groups most similar to Navajo are Immigrants from Haiti (81.6%, a difference of 0.10%), Immigrants from Portugal (81.6%, a difference of 0.10%), Dutch West Indian (81.6%, a difference of 0.14%), Fijian (81.6%, a difference of 0.20%), and Immigrants from Grenada (81.3%, a difference of 0.21%).
| Demographics | Rating | Rank | GED/Equivalency |
| Immigrants | Bangladesh | 0.0 /100 | #297 | Tragic 81.9% |
| Ute | 0.0 /100 | #298 | Tragic 81.8% |
| Ecuadorians | 0.0 /100 | #299 | Tragic 81.7% |
| Fijians | 0.0 /100 | #300 | Tragic 81.6% |
| Dutch West Indians | 0.0 /100 | #301 | Tragic 81.6% |
| Immigrants | Haiti | 0.0 /100 | #302 | Tragic 81.6% |
| Immigrants | Portugal | 0.0 /100 | #303 | Tragic 81.6% |
| Navajo | 0.0 /100 | #304 | Tragic 81.5% |
| Immigrants | Grenada | 0.0 /100 | #305 | Tragic 81.3% |
| Guyanese | 0.0 /100 | #306 | Tragic 81.3% |
| Immigrants | Dominica | 0.0 /100 | #307 | Tragic 81.1% |
| Puerto Ricans | 0.0 /100 | #308 | Tragic 81.1% |
| Immigrants | Ecuador | 0.0 /100 | #309 | Tragic 81.0% |
| Immigrants | Guyana | 0.0 /100 | #310 | Tragic 81.0% |
| Natives/Alaskans | 0.0 /100 | #311 | Tragic 80.9% |