Sudanese vs South American 9th Grade
COMPARE
Sudanese
South American
9th Grade
9th Grade Comparison
Sudanese
South Americans
94.7%
9TH GRADE
32.7/ 100
METRIC RATING
190th/ 347
METRIC RANK
93.9%
9TH GRADE
0.4/ 100
METRIC RATING
261st/ 347
METRIC RANK
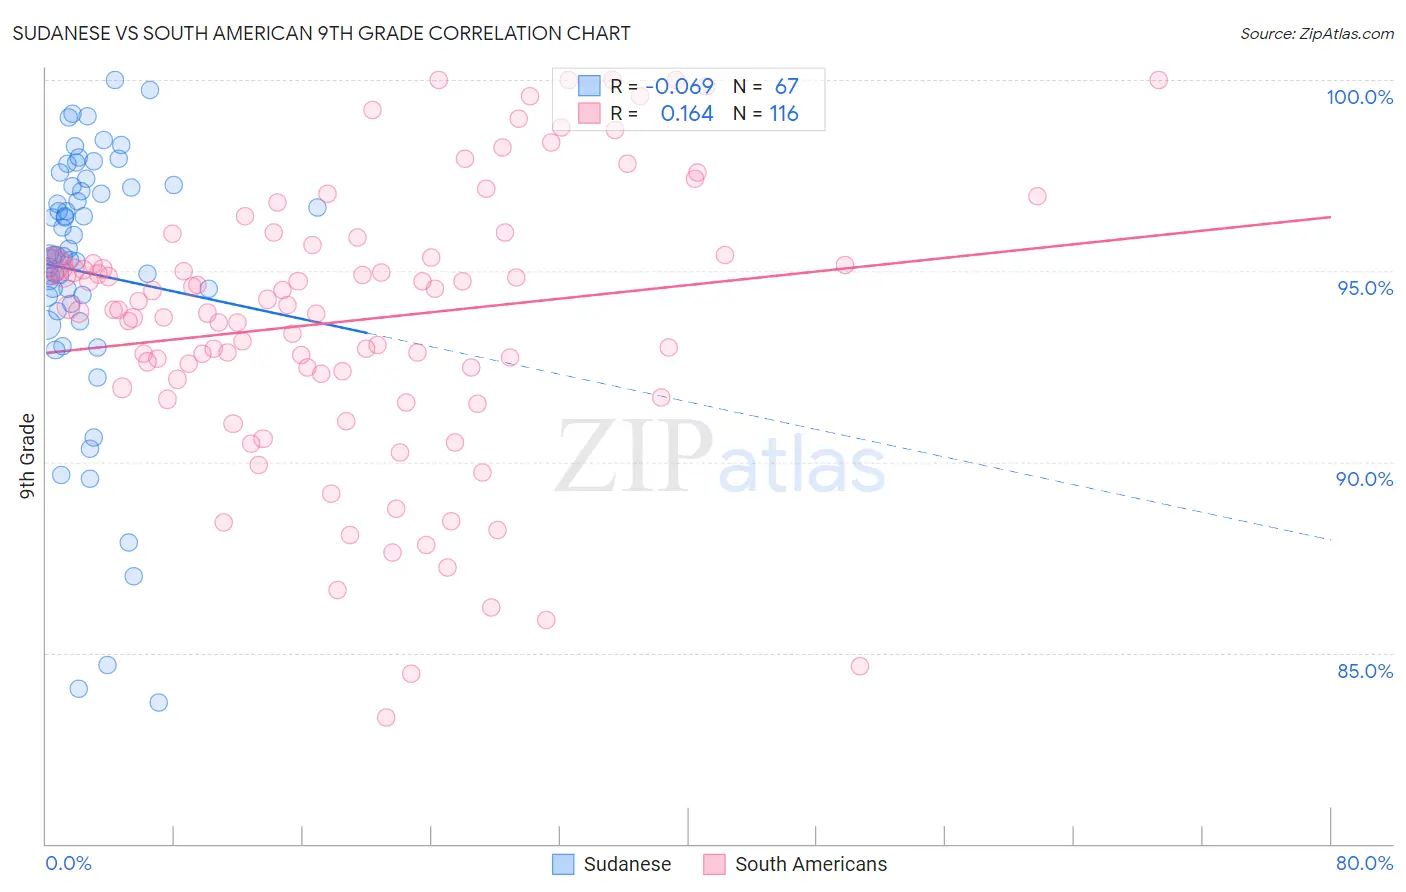
Sudanese vs South American 9th Grade Correlation Chart
The statistical analysis conducted on geographies consisting of 110,134,719 people shows a slight negative correlation between the proportion of Sudanese and percentage of population with at least 9th grade education in the United States with a correlation coefficient (R) of -0.069 and weighted average of 94.7%. Similarly, the statistical analysis conducted on geographies consisting of 494,065,697 people shows a poor positive correlation between the proportion of South Americans and percentage of population with at least 9th grade education in the United States with a correlation coefficient (R) of 0.164 and weighted average of 93.9%, a difference of 0.88%.
9th Grade Correlation Summary
| Measurement | Sudanese | South American |
| Minimum | 83.7% | 83.3% |
| Maximum | 100.0% | 100.0% |
| Range | 16.3% | 16.7% |
| Mean | 95.0% | 93.7% |
| Median | 95.4% | 94.0% |
| Interquartile 25% (IQ1) | 94.1% | 92.2% |
| Interquartile 75% (IQ3) | 97.2% | 95.4% |
| Interquartile Range (IQR) | 3.1% | 3.1% |
| Standard Deviation (Sample) | 3.5% | 3.6% |
| Standard Deviation (Population) | 3.5% | 3.6% |
Similar Demographics by 9th Grade
Demographics Similar to Sudanese by 9th Grade
In terms of 9th grade, the demographic groups most similar to Sudanese are Immigrants from Argentina (94.8%, a difference of 0.010%), Assyrian/Chaldean/Syriac (94.7%, a difference of 0.010%), Guamanian/Chamorro (94.8%, a difference of 0.020%), Immigrants from Albania (94.8%, a difference of 0.020%), and Immigrants from Northern Africa (94.7%, a difference of 0.020%).
| Demographics | Rating | Rank | 9th Grade |
| Immigrants | Nepal | 39.7 /100 | #183 | Fair 94.8% |
| Argentineans | 37.6 /100 | #184 | Fair 94.8% |
| Liberians | 37.4 /100 | #185 | Fair 94.8% |
| Hopi | 37.1 /100 | #186 | Fair 94.8% |
| Guamanians/Chamorros | 35.5 /100 | #187 | Fair 94.8% |
| Immigrants | Albania | 34.5 /100 | #188 | Fair 94.8% |
| Immigrants | Argentina | 34.4 /100 | #189 | Fair 94.8% |
| Sudanese | 32.7 /100 | #190 | Fair 94.7% |
| Assyrians/Chaldeans/Syriacs | 32.0 /100 | #191 | Fair 94.7% |
| Immigrants | Northern Africa | 30.7 /100 | #192 | Fair 94.7% |
| Paraguayans | 30.1 /100 | #193 | Fair 94.7% |
| Panamanians | 29.0 /100 | #194 | Fair 94.7% |
| Marshallese | 27.9 /100 | #195 | Fair 94.7% |
| Immigrants | Lebanon | 27.2 /100 | #196 | Fair 94.7% |
| Immigrants | Micronesia | 24.7 /100 | #197 | Fair 94.7% |
Demographics Similar to South Americans by 9th Grade
In terms of 9th grade, the demographic groups most similar to South Americans are Pima (93.9%, a difference of 0.010%), Immigrants from Thailand (93.9%, a difference of 0.020%), Ghanaian (93.9%, a difference of 0.020%), Immigrants from Jamaica (93.9%, a difference of 0.020%), and Immigrants from Uzbekistan (93.9%, a difference of 0.020%).
| Demographics | Rating | Rank | 9th Grade |
| U.S. Virgin Islanders | 0.7 /100 | #254 | Tragic 94.0% |
| Immigrants | Nigeria | 0.6 /100 | #255 | Tragic 94.0% |
| Immigrants | Afghanistan | 0.5 /100 | #256 | Tragic 94.0% |
| Immigrants | Costa Rica | 0.5 /100 | #257 | Tragic 94.0% |
| Immigrants | Thailand | 0.5 /100 | #258 | Tragic 93.9% |
| Ghanaians | 0.5 /100 | #259 | Tragic 93.9% |
| Pima | 0.4 /100 | #260 | Tragic 93.9% |
| South Americans | 0.4 /100 | #261 | Tragic 93.9% |
| Immigrants | Jamaica | 0.4 /100 | #262 | Tragic 93.9% |
| Immigrants | Uzbekistan | 0.4 /100 | #263 | Tragic 93.9% |
| Immigrants | Congo | 0.4 /100 | #264 | Tragic 93.9% |
| Natives/Alaskans | 0.4 /100 | #265 | Tragic 93.9% |
| Navajo | 0.3 /100 | #266 | Tragic 93.9% |
| Armenians | 0.3 /100 | #267 | Tragic 93.9% |
| Immigrants | Bolivia | 0.3 /100 | #268 | Tragic 93.9% |