Indian (Asian) vs Immigrants from Ethiopia 9th Grade
COMPARE
Indian (Asian)
Immigrants from Ethiopia
9th Grade
9th Grade Comparison
Indians (Asian)
Immigrants from Ethiopia
94.5%
9TH GRADE
8.6/ 100
METRIC RATING
220th/ 347
METRIC RANK
94.3%
9TH GRADE
2.7/ 100
METRIC RATING
240th/ 347
METRIC RANK
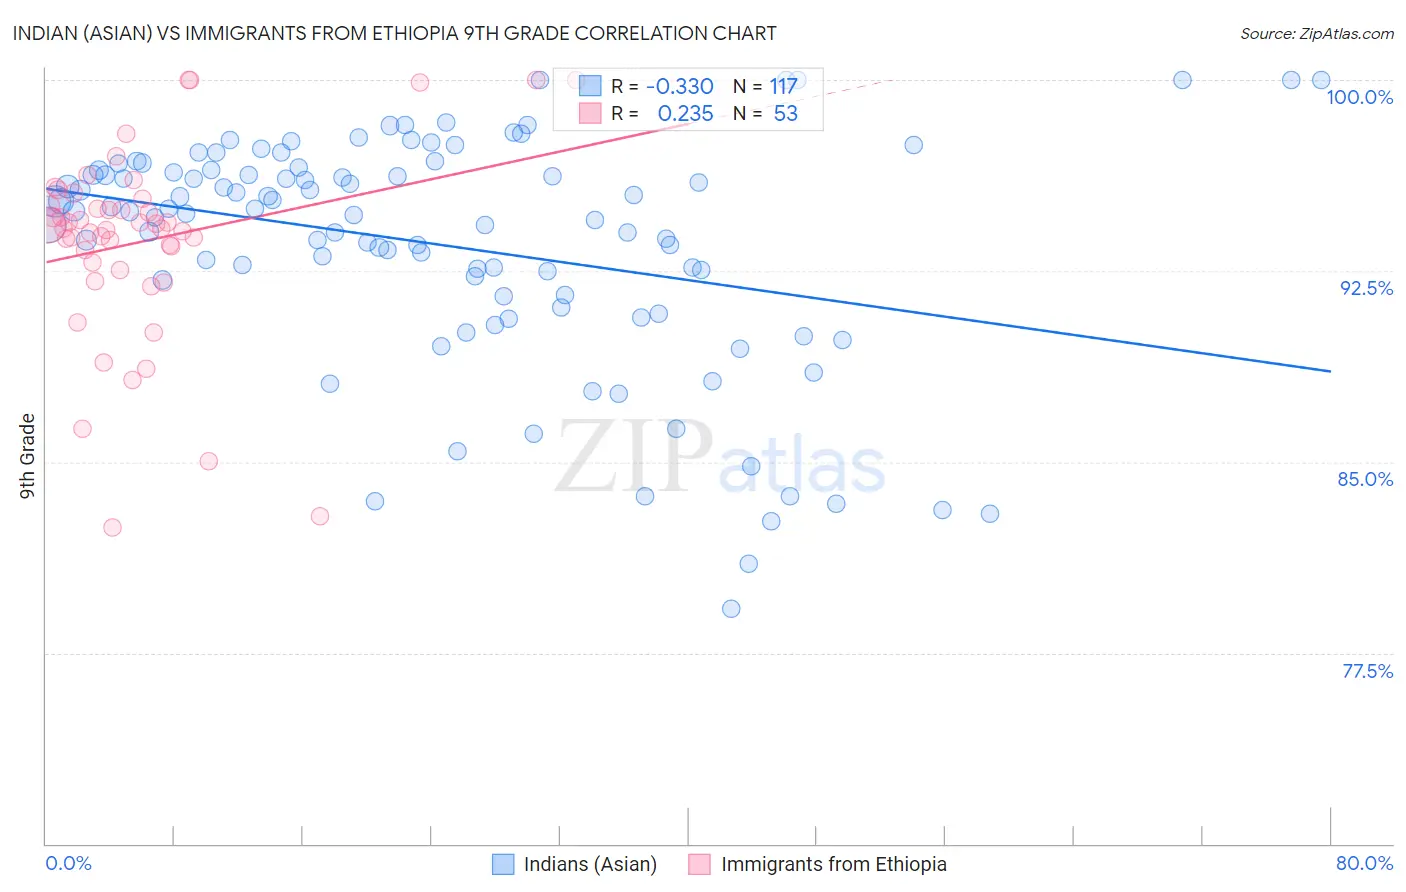
Indian (Asian) vs Immigrants from Ethiopia 9th Grade Correlation Chart
The statistical analysis conducted on geographies consisting of 495,348,182 people shows a mild negative correlation between the proportion of Indians (Asian) and percentage of population with at least 9th grade education in the United States with a correlation coefficient (R) of -0.330 and weighted average of 94.5%. Similarly, the statistical analysis conducted on geographies consisting of 211,528,629 people shows a weak positive correlation between the proportion of Immigrants from Ethiopia and percentage of population with at least 9th grade education in the United States with a correlation coefficient (R) of 0.235 and weighted average of 94.3%, a difference of 0.22%.
9th Grade Correlation Summary
| Measurement | Indian (Asian) | Immigrants from Ethiopia |
| Minimum | 79.3% | 82.4% |
| Maximum | 100.0% | 100.0% |
| Range | 20.7% | 17.6% |
| Mean | 93.5% | 93.7% |
| Median | 94.8% | 94.1% |
| Interquartile 25% (IQ1) | 91.5% | 92.7% |
| Interquartile 75% (IQ3) | 96.5% | 95.2% |
| Interquartile Range (IQR) | 5.0% | 2.5% |
| Standard Deviation (Sample) | 4.5% | 3.8% |
| Standard Deviation (Population) | 4.5% | 3.8% |
Demographics Similar to Indians (Asian) and Immigrants from Ethiopia by 9th Grade
In terms of 9th grade, the demographic groups most similar to Indians (Asian) are Immigrants from Eastern Africa (94.5%, a difference of 0.010%), Immigrants from Asia (94.4%, a difference of 0.020%), Bahamian (94.4%, a difference of 0.040%), Tongan (94.4%, a difference of 0.070%), and Ethiopian (94.4%, a difference of 0.090%). Similarly, the demographic groups most similar to Immigrants from Ethiopia are Korean (94.3%, a difference of 0.010%), South American Indian (94.3%, a difference of 0.010%), Immigrants from China (94.3%, a difference of 0.010%), Somali (94.3%, a difference of 0.020%), and Bolivian (94.3%, a difference of 0.040%).
| Demographics | Rating | Rank | 9th Grade |
| Indians (Asian) | 8.6 /100 | #220 | Tragic 94.5% |
| Immigrants | Eastern Africa | 8.2 /100 | #221 | Tragic 94.5% |
| Immigrants | Asia | 7.7 /100 | #222 | Tragic 94.4% |
| Bahamians | 7.0 /100 | #223 | Tragic 94.4% |
| Tongans | 6.0 /100 | #224 | Tragic 94.4% |
| Ethiopians | 5.4 /100 | #225 | Tragic 94.4% |
| Sub-Saharan Africans | 5.4 /100 | #226 | Tragic 94.4% |
| Immigrants | Sierra Leone | 4.8 /100 | #227 | Tragic 94.4% |
| Lumbee | 4.7 /100 | #228 | Tragic 94.4% |
| Immigrants | Southern Europe | 4.5 /100 | #229 | Tragic 94.3% |
| Apache | 4.2 /100 | #230 | Tragic 94.3% |
| Immigrants | Panama | 4.0 /100 | #231 | Tragic 94.3% |
| Immigrants | Africa | 3.9 /100 | #232 | Tragic 94.3% |
| Nigerians | 3.7 /100 | #233 | Tragic 94.3% |
| Costa Ricans | 3.5 /100 | #234 | Tragic 94.3% |
| Bolivians | 3.3 /100 | #235 | Tragic 94.3% |
| Somalis | 2.9 /100 | #236 | Tragic 94.3% |
| Koreans | 2.9 /100 | #237 | Tragic 94.3% |
| South American Indians | 2.8 /100 | #238 | Tragic 94.3% |
| Immigrants | China | 2.8 /100 | #239 | Tragic 94.3% |
| Immigrants | Ethiopia | 2.7 /100 | #240 | Tragic 94.3% |