Sudanese vs Houma 9th Grade
COMPARE
Sudanese
Houma
9th Grade
9th Grade Comparison
Sudanese
Houma
94.7%
9TH GRADE
32.7/ 100
METRIC RATING
190th/ 347
METRIC RANK
92.3%
9TH GRADE
0.0/ 100
METRIC RATING
312th/ 347
METRIC RANK
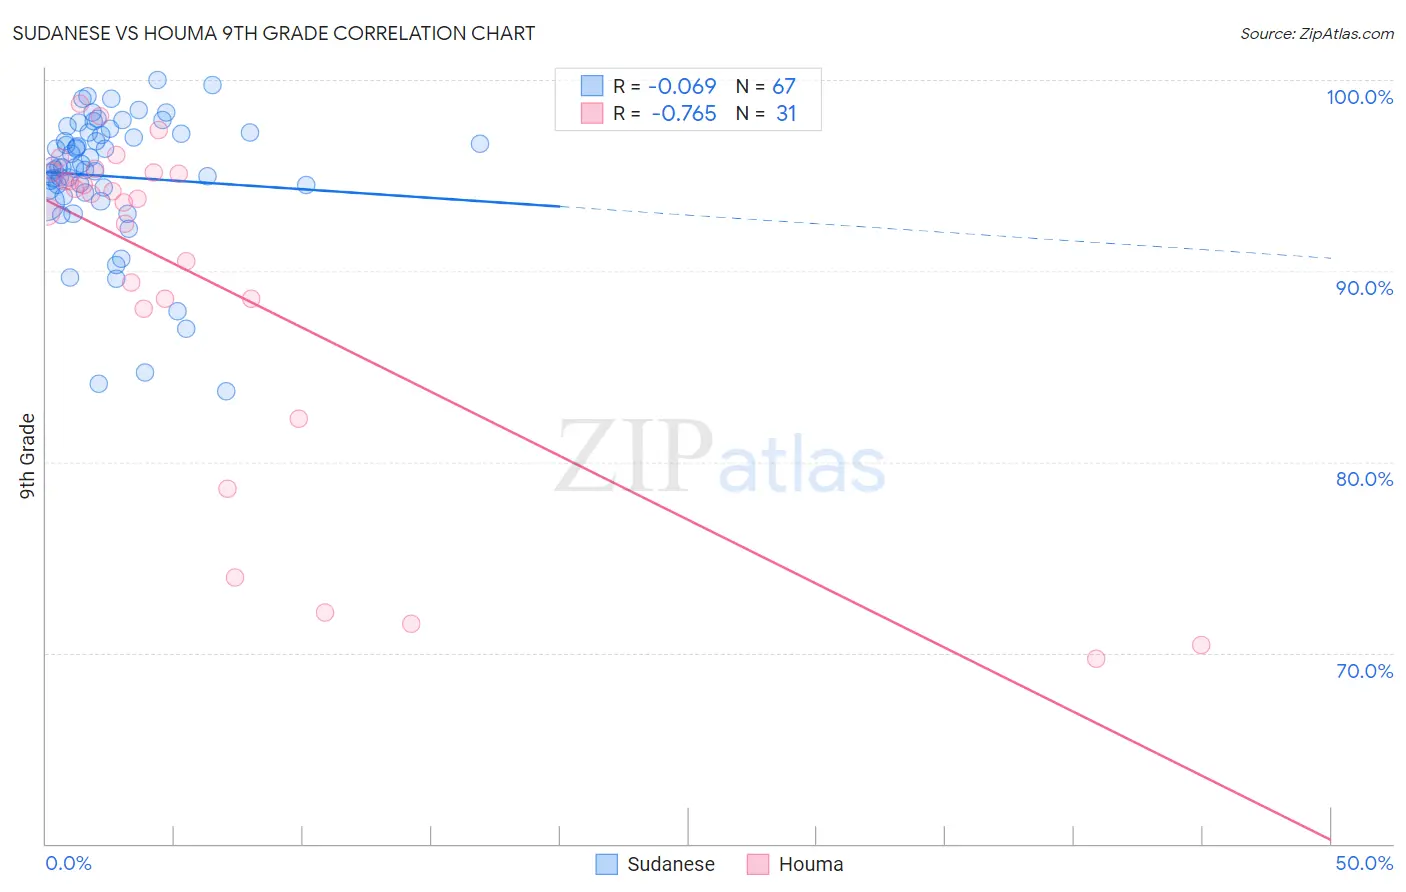
Sudanese vs Houma 9th Grade Correlation Chart
The statistical analysis conducted on geographies consisting of 110,134,719 people shows a slight negative correlation between the proportion of Sudanese and percentage of population with at least 9th grade education in the United States with a correlation coefficient (R) of -0.069 and weighted average of 94.7%. Similarly, the statistical analysis conducted on geographies consisting of 36,795,916 people shows a strong negative correlation between the proportion of Houma and percentage of population with at least 9th grade education in the United States with a correlation coefficient (R) of -0.765 and weighted average of 92.3%, a difference of 2.7%.
9th Grade Correlation Summary
| Measurement | Sudanese | Houma |
| Minimum | 83.7% | 69.7% |
| Maximum | 100.0% | 98.8% |
| Range | 16.3% | 29.0% |
| Mean | 95.0% | 89.4% |
| Median | 95.4% | 93.8% |
| Interquartile 25% (IQ1) | 94.1% | 88.0% |
| Interquartile 75% (IQ3) | 97.2% | 95.1% |
| Interquartile Range (IQR) | 3.1% | 7.1% |
| Standard Deviation (Sample) | 3.5% | 9.0% |
| Standard Deviation (Population) | 3.5% | 8.9% |
Similar Demographics by 9th Grade
Demographics Similar to Sudanese by 9th Grade
In terms of 9th grade, the demographic groups most similar to Sudanese are Immigrants from Argentina (94.8%, a difference of 0.010%), Assyrian/Chaldean/Syriac (94.7%, a difference of 0.010%), Guamanian/Chamorro (94.8%, a difference of 0.020%), Immigrants from Albania (94.8%, a difference of 0.020%), and Immigrants from Northern Africa (94.7%, a difference of 0.020%).
| Demographics | Rating | Rank | 9th Grade |
| Immigrants | Nepal | 39.7 /100 | #183 | Fair 94.8% |
| Argentineans | 37.6 /100 | #184 | Fair 94.8% |
| Liberians | 37.4 /100 | #185 | Fair 94.8% |
| Hopi | 37.1 /100 | #186 | Fair 94.8% |
| Guamanians/Chamorros | 35.5 /100 | #187 | Fair 94.8% |
| Immigrants | Albania | 34.5 /100 | #188 | Fair 94.8% |
| Immigrants | Argentina | 34.4 /100 | #189 | Fair 94.8% |
| Sudanese | 32.7 /100 | #190 | Fair 94.7% |
| Assyrians/Chaldeans/Syriacs | 32.0 /100 | #191 | Fair 94.7% |
| Immigrants | Northern Africa | 30.7 /100 | #192 | Fair 94.7% |
| Paraguayans | 30.1 /100 | #193 | Fair 94.7% |
| Panamanians | 29.0 /100 | #194 | Fair 94.7% |
| Marshallese | 27.9 /100 | #195 | Fair 94.7% |
| Immigrants | Lebanon | 27.2 /100 | #196 | Fair 94.7% |
| Immigrants | Micronesia | 24.7 /100 | #197 | Fair 94.7% |
Demographics Similar to Houma by 9th Grade
In terms of 9th grade, the demographic groups most similar to Houma are Vietnamese (92.3%, a difference of 0.020%), Immigrants from Fiji (92.3%, a difference of 0.030%), Immigrants from Cambodia (92.4%, a difference of 0.060%), Immigrants from Portugal (92.2%, a difference of 0.060%), and Immigrants from Caribbean (92.2%, a difference of 0.070%).
| Demographics | Rating | Rank | 9th Grade |
| Japanese | 0.0 /100 | #305 | Tragic 92.6% |
| Immigrants | Vietnam | 0.0 /100 | #306 | Tragic 92.6% |
| Immigrants | Immigrants | 0.0 /100 | #307 | Tragic 92.5% |
| Immigrants | Guyana | 0.0 /100 | #308 | Tragic 92.5% |
| Immigrants | Bangladesh | 0.0 /100 | #309 | Tragic 92.4% |
| Immigrants | Cambodia | 0.0 /100 | #310 | Tragic 92.4% |
| Immigrants | Fiji | 0.0 /100 | #311 | Tragic 92.3% |
| Houma | 0.0 /100 | #312 | Tragic 92.3% |
| Vietnamese | 0.0 /100 | #313 | Tragic 92.3% |
| Immigrants | Portugal | 0.0 /100 | #314 | Tragic 92.2% |
| Immigrants | Caribbean | 0.0 /100 | #315 | Tragic 92.2% |
| Cape Verdeans | 0.0 /100 | #316 | Tragic 92.2% |
| Immigrants | Cuba | 0.0 /100 | #317 | Tragic 92.2% |
| Nepalese | 0.0 /100 | #318 | Tragic 92.0% |
| Ecuadorians | 0.0 /100 | #319 | Tragic 91.9% |