Sudanese vs Immigrants from Eritrea 9th Grade
COMPARE
Sudanese
Immigrants from Eritrea
9th Grade
9th Grade Comparison
Sudanese
Immigrants from Eritrea
94.7%
9TH GRADE
32.7/ 100
METRIC RATING
190th/ 347
METRIC RANK
93.7%
9TH GRADE
0.1/ 100
METRIC RATING
278th/ 347
METRIC RANK
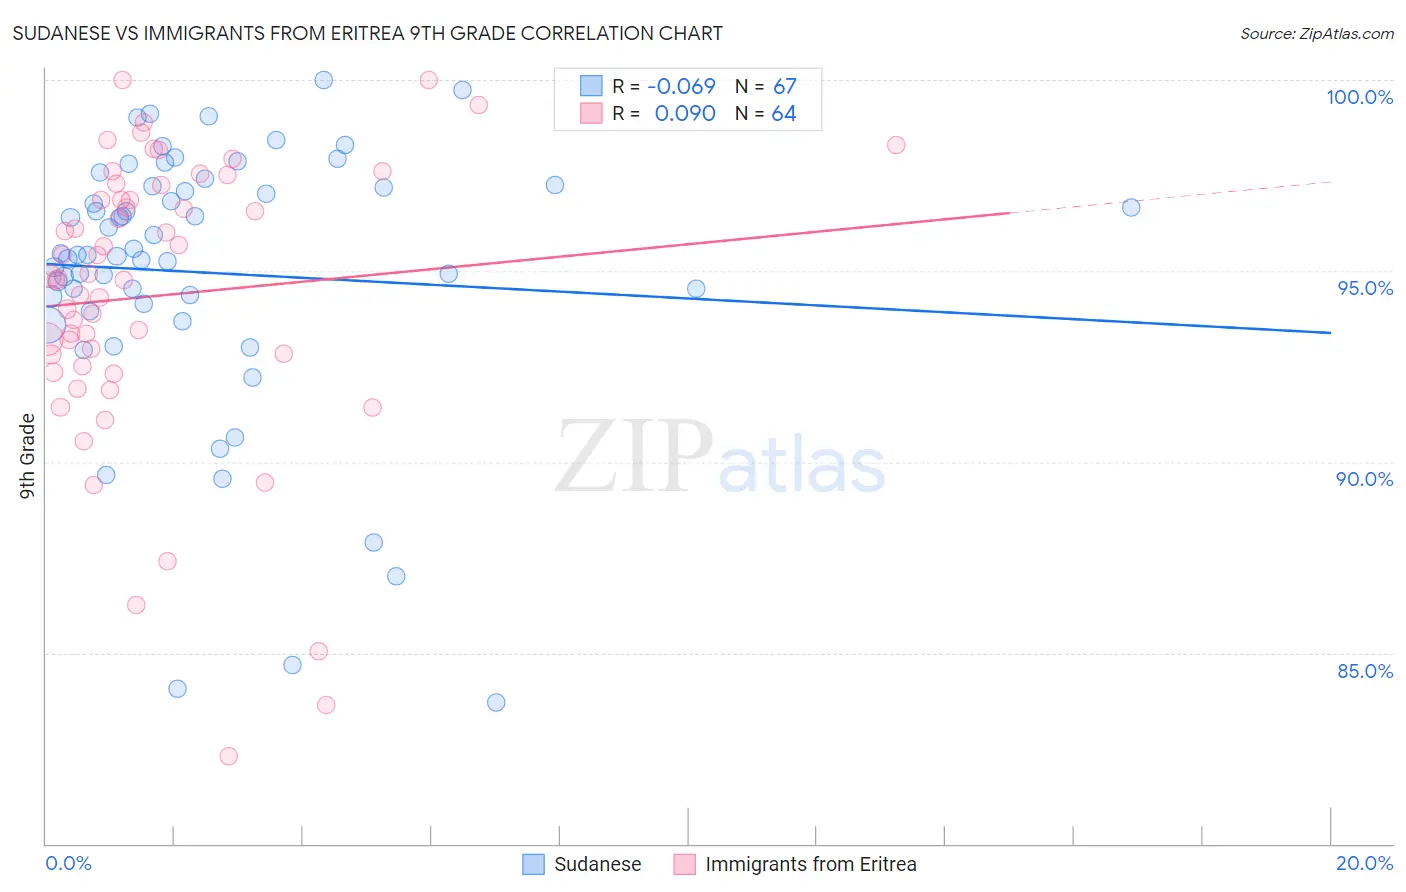
Sudanese vs Immigrants from Eritrea 9th Grade Correlation Chart
The statistical analysis conducted on geographies consisting of 110,134,719 people shows a slight negative correlation between the proportion of Sudanese and percentage of population with at least 9th grade education in the United States with a correlation coefficient (R) of -0.069 and weighted average of 94.7%. Similarly, the statistical analysis conducted on geographies consisting of 104,754,230 people shows a slight positive correlation between the proportion of Immigrants from Eritrea and percentage of population with at least 9th grade education in the United States with a correlation coefficient (R) of 0.090 and weighted average of 93.7%, a difference of 1.1%.
9th Grade Correlation Summary
| Measurement | Sudanese | Immigrants from Eritrea |
| Minimum | 83.7% | 82.3% |
| Maximum | 100.0% | 100.0% |
| Range | 16.3% | 17.7% |
| Mean | 95.0% | 94.3% |
| Median | 95.4% | 94.8% |
| Interquartile 25% (IQ1) | 94.1% | 92.7% |
| Interquartile 75% (IQ3) | 97.2% | 97.1% |
| Interquartile Range (IQR) | 3.1% | 4.4% |
| Standard Deviation (Sample) | 3.5% | 3.8% |
| Standard Deviation (Population) | 3.5% | 3.8% |
Similar Demographics by 9th Grade
Demographics Similar to Sudanese by 9th Grade
In terms of 9th grade, the demographic groups most similar to Sudanese are Immigrants from Argentina (94.8%, a difference of 0.010%), Assyrian/Chaldean/Syriac (94.7%, a difference of 0.010%), Guamanian/Chamorro (94.8%, a difference of 0.020%), Immigrants from Albania (94.8%, a difference of 0.020%), and Immigrants from Northern Africa (94.7%, a difference of 0.020%).
| Demographics | Rating | Rank | 9th Grade |
| Immigrants | Nepal | 39.7 /100 | #183 | Fair 94.8% |
| Argentineans | 37.6 /100 | #184 | Fair 94.8% |
| Liberians | 37.4 /100 | #185 | Fair 94.8% |
| Hopi | 37.1 /100 | #186 | Fair 94.8% |
| Guamanians/Chamorros | 35.5 /100 | #187 | Fair 94.8% |
| Immigrants | Albania | 34.5 /100 | #188 | Fair 94.8% |
| Immigrants | Argentina | 34.4 /100 | #189 | Fair 94.8% |
| Sudanese | 32.7 /100 | #190 | Fair 94.7% |
| Assyrians/Chaldeans/Syriacs | 32.0 /100 | #191 | Fair 94.7% |
| Immigrants | Northern Africa | 30.7 /100 | #192 | Fair 94.7% |
| Paraguayans | 30.1 /100 | #193 | Fair 94.7% |
| Panamanians | 29.0 /100 | #194 | Fair 94.7% |
| Marshallese | 27.9 /100 | #195 | Fair 94.7% |
| Immigrants | Lebanon | 27.2 /100 | #196 | Fair 94.7% |
| Immigrants | Micronesia | 24.7 /100 | #197 | Fair 94.7% |
Demographics Similar to Immigrants from Eritrea by 9th Grade
In terms of 9th grade, the demographic groups most similar to Immigrants from Eritrea are Immigrants from Philippines (93.7%, a difference of 0.0%), West Indian (93.7%, a difference of 0.010%), Immigrants from Colombia (93.8%, a difference of 0.030%), Immigrants from South America (93.8%, a difference of 0.040%), and Peruvian (93.8%, a difference of 0.040%).
| Demographics | Rating | Rank | 9th Grade |
| Immigrants | Ghana | 0.2 /100 | #271 | Tragic 93.8% |
| Immigrants | Western Africa | 0.2 /100 | #272 | Tragic 93.8% |
| Immigrants | South America | 0.2 /100 | #273 | Tragic 93.8% |
| Peruvians | 0.2 /100 | #274 | Tragic 93.8% |
| Immigrants | Colombia | 0.2 /100 | #275 | Tragic 93.8% |
| West Indians | 0.2 /100 | #276 | Tragic 93.7% |
| Immigrants | Philippines | 0.1 /100 | #277 | Tragic 93.7% |
| Immigrants | Eritrea | 0.1 /100 | #278 | Tragic 93.7% |
| Trinidadians and Tobagonians | 0.1 /100 | #279 | Tragic 93.7% |
| Taiwanese | 0.1 /100 | #280 | Tragic 93.6% |
| Immigrants | Trinidad and Tobago | 0.1 /100 | #281 | Tragic 93.6% |
| Malaysians | 0.0 /100 | #282 | Tragic 93.5% |
| Barbadians | 0.0 /100 | #283 | Tragic 93.5% |
| Bangladeshis | 0.0 /100 | #284 | Tragic 93.4% |
| Immigrants | Peru | 0.0 /100 | #285 | Tragic 93.4% |