Immigrants from Western Asia vs Immigrants from Eritrea 9th Grade
COMPARE
Immigrants from Western Asia
Immigrants from Eritrea
9th Grade
9th Grade Comparison
Immigrants from Western Asia
Immigrants from Eritrea
94.5%
9TH GRADE
10.7/ 100
METRIC RATING
216th/ 347
METRIC RANK
93.7%
9TH GRADE
0.1/ 100
METRIC RATING
278th/ 347
METRIC RANK
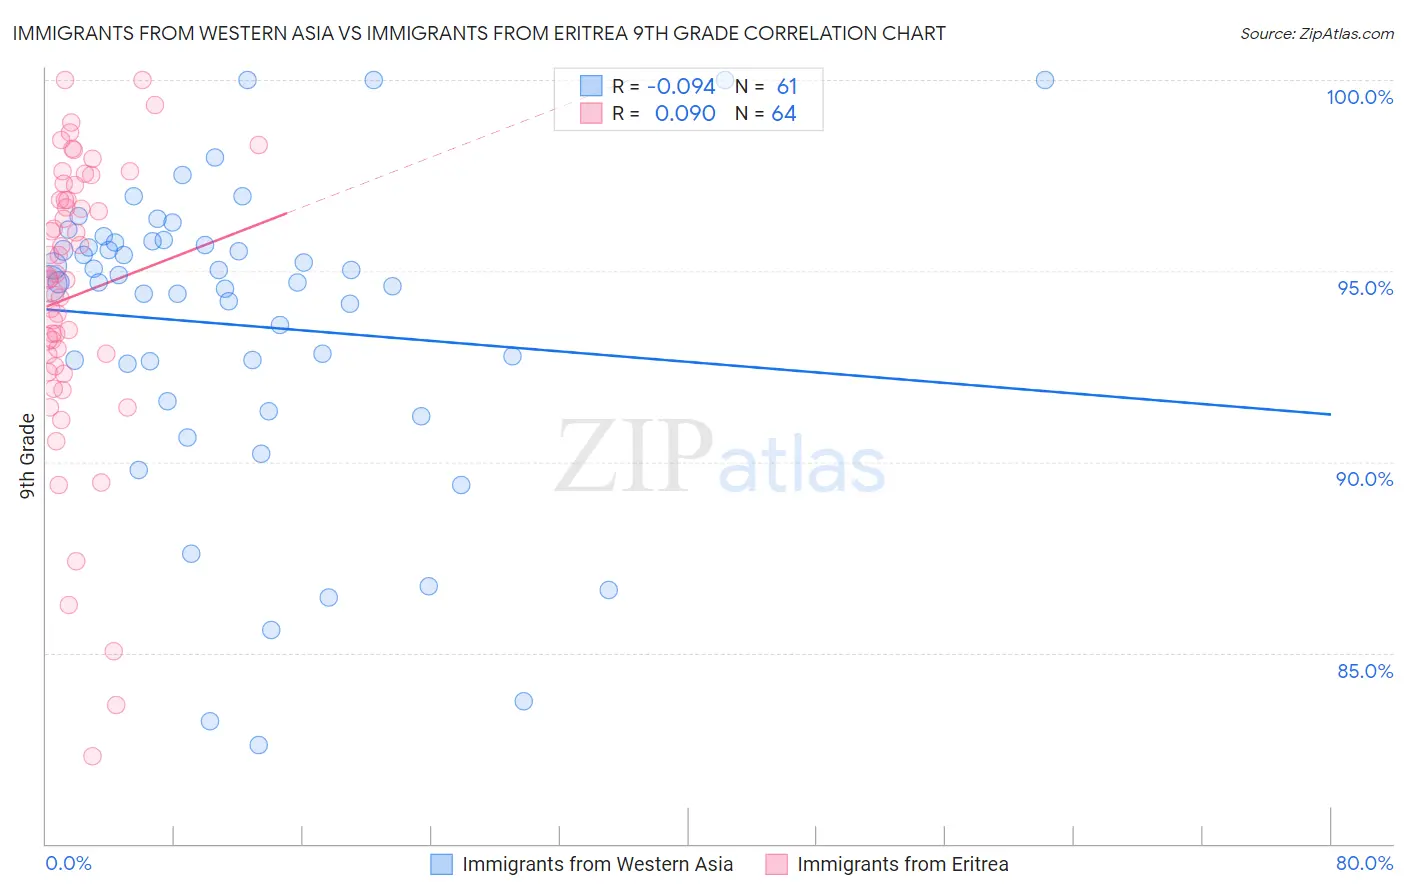
Immigrants from Western Asia vs Immigrants from Eritrea 9th Grade Correlation Chart
The statistical analysis conducted on geographies consisting of 404,433,811 people shows a slight negative correlation between the proportion of Immigrants from Western Asia and percentage of population with at least 9th grade education in the United States with a correlation coefficient (R) of -0.094 and weighted average of 94.5%. Similarly, the statistical analysis conducted on geographies consisting of 104,754,230 people shows a slight positive correlation between the proportion of Immigrants from Eritrea and percentage of population with at least 9th grade education in the United States with a correlation coefficient (R) of 0.090 and weighted average of 93.7%, a difference of 0.82%.
9th Grade Correlation Summary
| Measurement | Immigrants from Western Asia | Immigrants from Eritrea |
| Minimum | 82.6% | 82.3% |
| Maximum | 100.0% | 100.0% |
| Range | 17.4% | 17.7% |
| Mean | 93.6% | 94.3% |
| Median | 94.7% | 94.8% |
| Interquartile 25% (IQ1) | 92.1% | 92.7% |
| Interquartile 75% (IQ3) | 95.8% | 97.1% |
| Interquartile Range (IQR) | 3.7% | 4.4% |
| Standard Deviation (Sample) | 4.0% | 3.8% |
| Standard Deviation (Population) | 4.0% | 3.8% |
Similar Demographics by 9th Grade
Demographics Similar to Immigrants from Western Asia by 9th Grade
In terms of 9th grade, the demographic groups most similar to Immigrants from Western Asia are Immigrants from Syria (94.5%, a difference of 0.010%), Immigrants from Liberia (94.5%, a difference of 0.020%), Asian (94.5%, a difference of 0.020%), Immigrants from Indonesia (94.5%, a difference of 0.030%), and Immigrants from Malaysia (94.5%, a difference of 0.030%).
| Demographics | Rating | Rank | 9th Grade |
| Comanche | 14.9 /100 | #209 | Poor 94.6% |
| Immigrants | Chile | 13.4 /100 | #210 | Poor 94.5% |
| Immigrants | Indonesia | 12.3 /100 | #211 | Poor 94.5% |
| Immigrants | Malaysia | 12.2 /100 | #212 | Poor 94.5% |
| Immigrants | Oceania | 12.1 /100 | #213 | Poor 94.5% |
| Immigrants | Liberia | 11.8 /100 | #214 | Poor 94.5% |
| Immigrants | Syria | 11.0 /100 | #215 | Poor 94.5% |
| Immigrants | Western Asia | 10.7 /100 | #216 | Poor 94.5% |
| Asians | 9.9 /100 | #217 | Tragic 94.5% |
| Portuguese | 9.2 /100 | #218 | Tragic 94.5% |
| Africans | 9.0 /100 | #219 | Tragic 94.5% |
| Indians (Asian) | 8.6 /100 | #220 | Tragic 94.5% |
| Immigrants | Eastern Africa | 8.2 /100 | #221 | Tragic 94.5% |
| Immigrants | Asia | 7.7 /100 | #222 | Tragic 94.4% |
| Bahamians | 7.0 /100 | #223 | Tragic 94.4% |
Demographics Similar to Immigrants from Eritrea by 9th Grade
In terms of 9th grade, the demographic groups most similar to Immigrants from Eritrea are Immigrants from Philippines (93.7%, a difference of 0.0%), West Indian (93.7%, a difference of 0.010%), Immigrants from Colombia (93.8%, a difference of 0.030%), Immigrants from South America (93.8%, a difference of 0.040%), and Peruvian (93.8%, a difference of 0.040%).
| Demographics | Rating | Rank | 9th Grade |
| Immigrants | Ghana | 0.2 /100 | #271 | Tragic 93.8% |
| Immigrants | Western Africa | 0.2 /100 | #272 | Tragic 93.8% |
| Immigrants | South America | 0.2 /100 | #273 | Tragic 93.8% |
| Peruvians | 0.2 /100 | #274 | Tragic 93.8% |
| Immigrants | Colombia | 0.2 /100 | #275 | Tragic 93.8% |
| West Indians | 0.2 /100 | #276 | Tragic 93.7% |
| Immigrants | Philippines | 0.1 /100 | #277 | Tragic 93.7% |
| Immigrants | Eritrea | 0.1 /100 | #278 | Tragic 93.7% |
| Trinidadians and Tobagonians | 0.1 /100 | #279 | Tragic 93.7% |
| Taiwanese | 0.1 /100 | #280 | Tragic 93.6% |
| Immigrants | Trinidad and Tobago | 0.1 /100 | #281 | Tragic 93.6% |
| Malaysians | 0.0 /100 | #282 | Tragic 93.5% |
| Barbadians | 0.0 /100 | #283 | Tragic 93.5% |
| Bangladeshis | 0.0 /100 | #284 | Tragic 93.4% |
| Immigrants | Peru | 0.0 /100 | #285 | Tragic 93.4% |