Immigrants from Grenada vs Immigrants from Eritrea 9th Grade
COMPARE
Immigrants from Grenada
Immigrants from Eritrea
9th Grade
9th Grade Comparison
Immigrants from Grenada
Immigrants from Eritrea
93.0%
9TH GRADE
0.0/ 100
METRIC RATING
299th/ 347
METRIC RANK
93.7%
9TH GRADE
0.1/ 100
METRIC RATING
278th/ 347
METRIC RANK
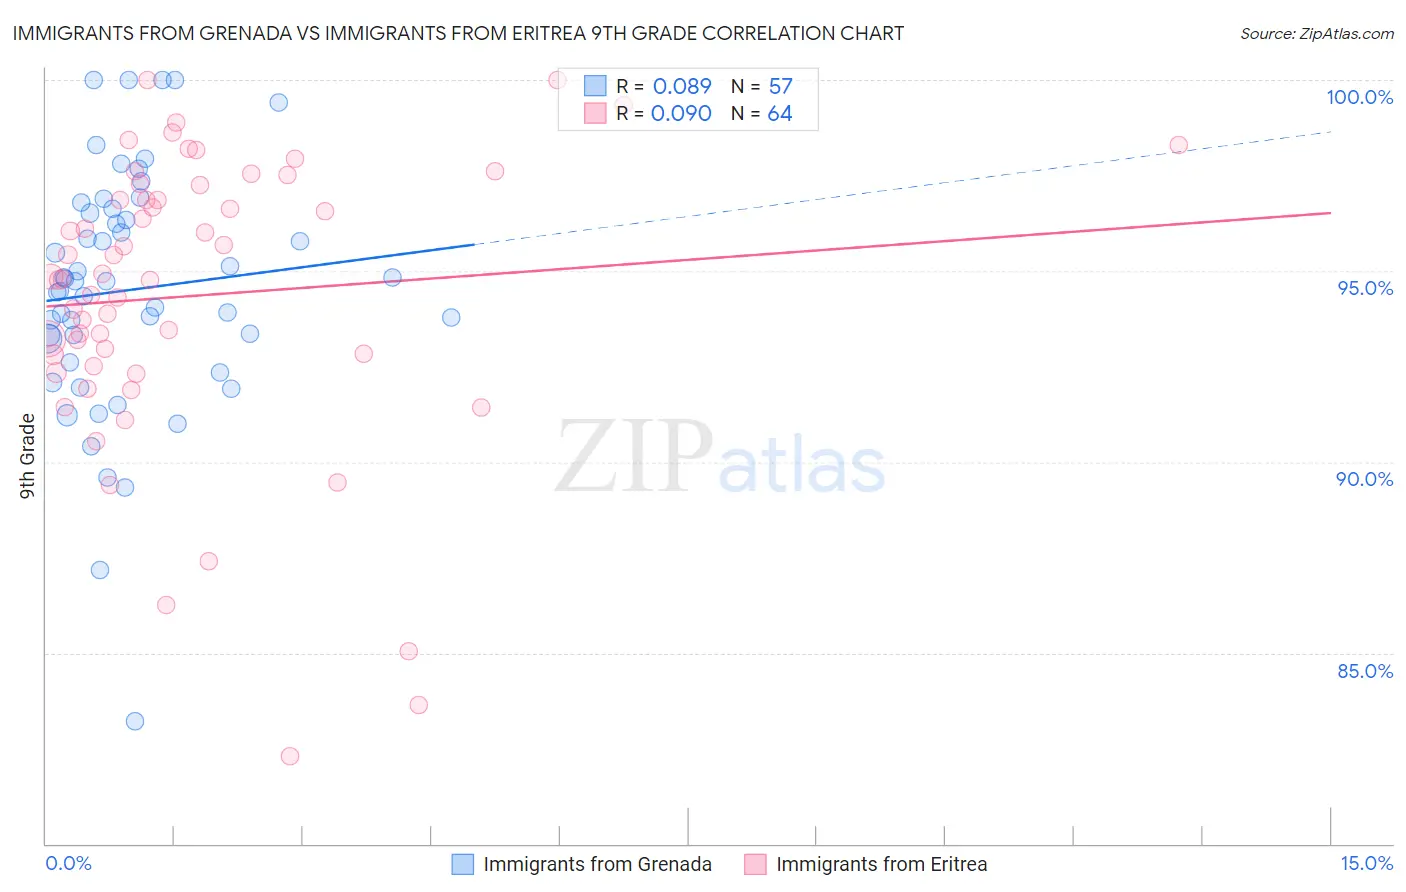
Immigrants from Grenada vs Immigrants from Eritrea 9th Grade Correlation Chart
The statistical analysis conducted on geographies consisting of 67,193,627 people shows a slight positive correlation between the proportion of Immigrants from Grenada and percentage of population with at least 9th grade education in the United States with a correlation coefficient (R) of 0.089 and weighted average of 93.0%. Similarly, the statistical analysis conducted on geographies consisting of 104,754,230 people shows a slight positive correlation between the proportion of Immigrants from Eritrea and percentage of population with at least 9th grade education in the United States with a correlation coefficient (R) of 0.090 and weighted average of 93.7%, a difference of 0.76%.
9th Grade Correlation Summary
| Measurement | Immigrants from Grenada | Immigrants from Eritrea |
| Minimum | 83.2% | 82.3% |
| Maximum | 100.0% | 100.0% |
| Range | 16.8% | 17.7% |
| Mean | 94.5% | 94.3% |
| Median | 94.7% | 94.8% |
| Interquartile 25% (IQ1) | 92.9% | 92.7% |
| Interquartile 75% (IQ3) | 96.6% | 97.1% |
| Interquartile Range (IQR) | 3.7% | 4.4% |
| Standard Deviation (Sample) | 3.2% | 3.8% |
| Standard Deviation (Population) | 3.2% | 3.8% |
Similar Demographics by 9th Grade
Demographics Similar to Immigrants from Grenada by 9th Grade
In terms of 9th grade, the demographic groups most similar to Immigrants from Grenada are Haitian (93.1%, a difference of 0.060%), Fijian (93.1%, a difference of 0.090%), Immigrants from Burma/Myanmar (93.1%, a difference of 0.12%), Indonesian (93.1%, a difference of 0.12%), and Yaqui (92.9%, a difference of 0.13%).
| Demographics | Rating | Rank | 9th Grade |
| Immigrants | Laos | 0.0 /100 | #292 | Tragic 93.2% |
| Sri Lankans | 0.0 /100 | #293 | Tragic 93.2% |
| Cubans | 0.0 /100 | #294 | Tragic 93.2% |
| Immigrants | Burma/Myanmar | 0.0 /100 | #295 | Tragic 93.1% |
| Indonesians | 0.0 /100 | #296 | Tragic 93.1% |
| Fijians | 0.0 /100 | #297 | Tragic 93.1% |
| Haitians | 0.0 /100 | #298 | Tragic 93.1% |
| Immigrants | Grenada | 0.0 /100 | #299 | Tragic 93.0% |
| Yaqui | 0.0 /100 | #300 | Tragic 92.9% |
| Immigrants | Haiti | 0.0 /100 | #301 | Tragic 92.7% |
| Immigrants | Dominica | 0.0 /100 | #302 | Tragic 92.7% |
| Guyanese | 0.0 /100 | #303 | Tragic 92.7% |
| Tohono O'odham | 0.0 /100 | #304 | Tragic 92.6% |
| Japanese | 0.0 /100 | #305 | Tragic 92.6% |
| Immigrants | Vietnam | 0.0 /100 | #306 | Tragic 92.6% |
Demographics Similar to Immigrants from Eritrea by 9th Grade
In terms of 9th grade, the demographic groups most similar to Immigrants from Eritrea are Immigrants from Philippines (93.7%, a difference of 0.0%), West Indian (93.7%, a difference of 0.010%), Immigrants from Colombia (93.8%, a difference of 0.030%), Immigrants from South America (93.8%, a difference of 0.040%), and Peruvian (93.8%, a difference of 0.040%).
| Demographics | Rating | Rank | 9th Grade |
| Immigrants | Ghana | 0.2 /100 | #271 | Tragic 93.8% |
| Immigrants | Western Africa | 0.2 /100 | #272 | Tragic 93.8% |
| Immigrants | South America | 0.2 /100 | #273 | Tragic 93.8% |
| Peruvians | 0.2 /100 | #274 | Tragic 93.8% |
| Immigrants | Colombia | 0.2 /100 | #275 | Tragic 93.8% |
| West Indians | 0.2 /100 | #276 | Tragic 93.7% |
| Immigrants | Philippines | 0.1 /100 | #277 | Tragic 93.7% |
| Immigrants | Eritrea | 0.1 /100 | #278 | Tragic 93.7% |
| Trinidadians and Tobagonians | 0.1 /100 | #279 | Tragic 93.7% |
| Taiwanese | 0.1 /100 | #280 | Tragic 93.6% |
| Immigrants | Trinidad and Tobago | 0.1 /100 | #281 | Tragic 93.6% |
| Malaysians | 0.0 /100 | #282 | Tragic 93.5% |
| Barbadians | 0.0 /100 | #283 | Tragic 93.5% |
| Bangladeshis | 0.0 /100 | #284 | Tragic 93.4% |
| Immigrants | Peru | 0.0 /100 | #285 | Tragic 93.4% |