Immigrants from Ecuador vs Trinidadian and Tobagonian Professional Degree
COMPARE
Immigrants from Ecuador
Trinidadian and Tobagonian
Professional Degree
Professional Degree Comparison
Immigrants from Ecuador
Trinidadians and Tobagonians
3.8%
PROFESSIONAL DEGREE
2.3/ 100
METRIC RATING
240th/ 347
METRIC RANK
4.0%
PROFESSIONAL DEGREE
7.1/ 100
METRIC RATING
224th/ 347
METRIC RANK
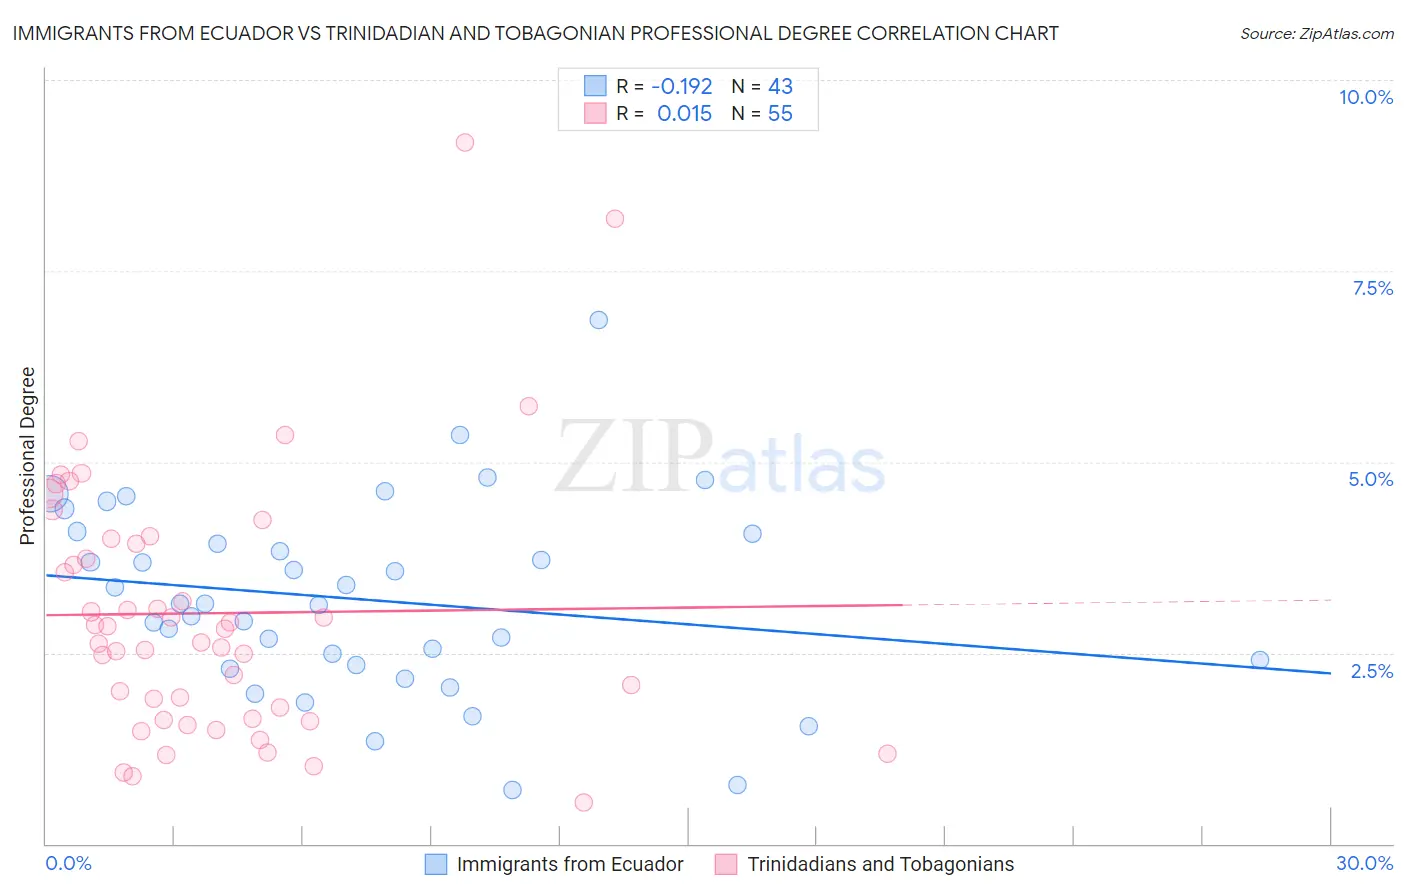
Immigrants from Ecuador vs Trinidadian and Tobagonian Professional Degree Correlation Chart
The statistical analysis conducted on geographies consisting of 270,711,574 people shows a poor negative correlation between the proportion of Immigrants from Ecuador and percentage of population with at least professional degree education in the United States with a correlation coefficient (R) of -0.192 and weighted average of 3.8%. Similarly, the statistical analysis conducted on geographies consisting of 219,572,491 people shows no correlation between the proportion of Trinidadians and Tobagonians and percentage of population with at least professional degree education in the United States with a correlation coefficient (R) of 0.015 and weighted average of 4.0%, a difference of 5.0%.
Professional Degree Correlation Summary
| Measurement | Immigrants from Ecuador | Trinidadian and Tobagonian |
| Minimum | 0.70% | 0.53% |
| Maximum | 6.9% | 9.2% |
| Range | 6.2% | 8.7% |
| Mean | 3.2% | 3.0% |
| Median | 3.1% | 2.8% |
| Interquartile 25% (IQ1) | 2.3% | 1.6% |
| Interquartile 75% (IQ3) | 4.1% | 4.0% |
| Interquartile Range (IQR) | 1.7% | 2.4% |
| Standard Deviation (Sample) | 1.3% | 1.7% |
| Standard Deviation (Population) | 1.2% | 1.7% |
Demographics Similar to Immigrants from Ecuador and Trinidadians and Tobagonians by Professional Degree
In terms of professional degree, the demographic groups most similar to Immigrants from Ecuador are Alaskan Athabascan (3.8%, a difference of 0.020%), Native Hawaiian (3.8%, a difference of 0.020%), British West Indian (3.8%, a difference of 0.23%), Colville (3.8%, a difference of 0.62%), and Immigrants from Trinidad and Tobago (3.9%, a difference of 2.2%). Similarly, the demographic groups most similar to Trinidadians and Tobagonians are Tlingit-Haida (4.0%, a difference of 0.13%), Immigrants from Bosnia and Herzegovina (4.0%, a difference of 0.14%), Immigrants from Western Africa (4.0%, a difference of 0.22%), German Russian (4.0%, a difference of 0.68%), and Cuban (4.0%, a difference of 0.81%).
| Demographics | Rating | Rank | Professional Degree |
| Immigrants | Western Africa | 7.5 /100 | #222 | Tragic 4.0% |
| Immigrants | Bosnia and Herzegovina | 7.4 /100 | #223 | Tragic 4.0% |
| Trinidadians and Tobagonians | 7.1 /100 | #224 | Tragic 4.0% |
| Tlingit-Haida | 6.9 /100 | #225 | Tragic 4.0% |
| German Russians | 6.1 /100 | #226 | Tragic 4.0% |
| Cubans | 5.9 /100 | #227 | Tragic 4.0% |
| Immigrants | West Indies | 5.6 /100 | #228 | Tragic 4.0% |
| Immigrants | Burma/Myanmar | 5.4 /100 | #229 | Tragic 3.9% |
| Nicaraguans | 5.1 /100 | #230 | Tragic 3.9% |
| Ecuadorians | 4.6 /100 | #231 | Tragic 3.9% |
| Cree | 4.3 /100 | #232 | Tragic 3.9% |
| Immigrants | Philippines | 4.1 /100 | #233 | Tragic 3.9% |
| Immigrants | Nonimmigrants | 4.0 /100 | #234 | Tragic 3.9% |
| Immigrants | Barbados | 4.0 /100 | #235 | Tragic 3.9% |
| Spanish Americans | 3.8 /100 | #236 | Tragic 3.9% |
| Immigrants | Trinidad and Tobago | 3.8 /100 | #237 | Tragic 3.9% |
| Colville | 2.6 /100 | #238 | Tragic 3.8% |
| British West Indians | 2.4 /100 | #239 | Tragic 3.8% |
| Immigrants | Ecuador | 2.3 /100 | #240 | Tragic 3.8% |
| Alaskan Athabascans | 2.3 /100 | #241 | Tragic 3.8% |
| Native Hawaiians | 2.3 /100 | #242 | Tragic 3.8% |