Subsaharan African vs Immigrants from France Professional Degree

COMPARE

Subsaharan African
Race
Ancestry
AfghanAfricanAlaska NativeAlaskan AthabascanAlbanianAleutAlsatianAmericanApacheArabArapahoArgentineanArmenianAssyrian/Chaldean/SyriacAustralianAustrianBahamianBangladeshiBarbadianBasqueBelgianBelizeanBermudanBhutaneseBlackfeetBolivianBrazilianBritishBritish West IndianBulgarianBurmeseCajunCambodianCanadianCape VerdeanCarpatho RusynCelticCentral AmericanCentral American IndianCherokeeCheyenneChickasawChileanChineseChippewaChoctawColombianColvilleComancheCosta RicanCreeCreekCroatianCrowCubanCypriotCzechCzechoslovakianDanishDelawareDominicanDutchDutch West IndianEastern EuropeanEcuadorianEgyptianEnglishEstonianEthiopianEuropeanFijianFilipinoFinnishFrenchFrench American IndianFrench CanadianGermanGerman RussianGhanaianGreekGuamanian/ChamorroGuatemalanGuyaneseHaitianHmongHonduranHopiHoumaHungarianIcelanderIndian (Asian)IndonesianInupiatIranianIraqiIrishIroquoisIsraeliItalianJamaicanJapaneseJordanianKenyanKiowaKoreanLaotianLatvianLebaneseLiberianLithuanianLumbeeLuxembourgerMacedonianMalaysianMalteseMarshalleseMenomineeMexicanMexican American IndianMongolianMoroccanNative HawaiianNavajoNepaleseNew ZealanderNicaraguanNigerianNorthern EuropeanNorwegianOkinawanOsageOttawaPaiutePakistaniPalestinianPanamanianParaguayanPennsylvania GermanPeruvianPimaPolishPortuguesePotawatomiPuebloPuerto RicanPuget Sound SalishRomanianRussianSalvadoranSamoanScandinavianScotch-IrishScottishSeminoleSenegaleseSerbianShoshoneSierra LeoneanSiouxSlavicSlovakSloveneSomaliSouth AfricanSouth AmericanSouth American IndianSoviet UnionSpaniardSpanishSpanish AmericanSpanish American IndianSri LankanSubsaharan AfricanSudaneseSwedishSwissSyrianTaiwaneseThaiTlingit-HaidaTohono O'OdhamTonganTrinidadian and TobagonianTsimshianTurkishU.S. Virgin IslanderUgandanUkrainianUruguayanUteVenezuelanVietnameseWelshWest IndianYakamaYaquiYugoslavianYumanYup'ikZimbabwean
Immigration
NonimmigrantsImmigrantsAfghanistanAfricaAlbaniaArgentinaArmeniaAsiaAustraliaAustriaBahamasBangladeshBarbadosBelarusBelgiumBelizeBoliviaBosnia and HerzegovinaBrazilBulgariaBurma/MyanmarCabo VerdeCambodiaCameroonCanadaCaribbeanCentral AmericaChileChinaColombiaCongoCosta RicaCroatiaCubaCzechoslovakiaDenmarkDominicaDominican RepublicEastern AfricaEastern AsiaEastern EuropeEcuadorEgyptEl SalvadorEnglandEritreaEthiopiaEuropeFijiGermanyGhanaGreeceGrenadaGuatemalaGuyanaHaitiHondurasHong KongHungaryIndiaIndonesiaIranIraqIrelandIsraelItalyJamaicaJapanJordanKazakhstanKenyaKoreaKuwaitLaosLatin AmericaLatviaLebanonLiberiaLithuaniaMalaysiaMexicoMicronesiaMiddle AfricaMoldovaMoroccoNepalNetherlandsNicaraguaNigeriaNorth AmericaNorth MacedoniaNorthern AfricaNorthern EuropeNorwayOceaniaPakistanPanamaPeruPhilippinesPolandPortugalRomaniaRussiaSaudi ArabiaScotlandSenegalSerbiaSierra LeoneSingaporeSomaliaSouth AfricaSouth AmericaSouth Central AsiaSouth Eastern AsiaSouthern EuropeSpainSri LankaSt. Vincent and the GrenadinesSudanSwedenSwitzerlandSyriaTaiwanThailandTrinidad and TobagoTurkeyUgandaUkraineUruguayUzbekistanVenezuelaVietnamWest IndiesWestern AfricaWestern AsiaWestern EuropeYemenZaireZimbabweAzores
Immigrants from France
Race
Ancestry
AfghanAfricanAlaska NativeAlaskan AthabascanAlbanianAleutAlsatianAmericanApacheArabArapahoArgentineanArmenianAssyrian/Chaldean/SyriacAustralianAustrianBahamianBangladeshiBarbadianBasqueBelgianBelizeanBermudanBhutaneseBlackfeetBolivianBrazilianBritishBritish West IndianBulgarianBurmeseCajunCambodianCanadianCape VerdeanCarpatho RusynCelticCentral AmericanCentral American IndianCherokeeCheyenneChickasawChileanChineseChippewaChoctawColombianColvilleComancheCosta RicanCreeCreekCroatianCrowCubanCypriotCzechCzechoslovakianDanishDelawareDominicanDutchDutch West IndianEastern EuropeanEcuadorianEgyptianEnglishEstonianEthiopianEuropeanFijianFilipinoFinnishFrenchFrench American IndianFrench CanadianGermanGerman RussianGhanaianGreekGuamanian/ChamorroGuatemalanGuyaneseHaitianHmongHonduranHopiHoumaHungarianIcelanderIndian (Asian)IndonesianInupiatIranianIraqiIrishIroquoisIsraeliItalianJamaicanJapaneseJordanianKenyanKiowaKoreanLaotianLatvianLebaneseLiberianLithuanianLumbeeLuxembourgerMacedonianMalaysianMalteseMarshalleseMenomineeMexicanMexican American IndianMongolianMoroccanNative HawaiianNavajoNepaleseNew ZealanderNicaraguanNigerianNorthern EuropeanNorwegianOkinawanOsageOttawaPaiutePakistaniPalestinianPanamanianParaguayanPennsylvania GermanPeruvianPimaPolishPortuguesePotawatomiPuebloPuerto RicanPuget Sound SalishRomanianRussianSalvadoranSamoanScandinavianScotch-IrishScottishSeminoleSenegaleseSerbianShoshoneSierra LeoneanSiouxSlavicSlovakSloveneSomaliSouth AfricanSouth AmericanSouth American IndianSoviet UnionSpaniardSpanishSpanish AmericanSpanish American IndianSri LankanSudaneseSwedishSwissSyrianTaiwaneseThaiTlingit-HaidaTohono O'OdhamTonganTrinidadian and TobagonianTsimshianTurkishU.S. Virgin IslanderUgandanUkrainianUruguayanUteVenezuelanVietnameseWelshWest IndianYakamaYaquiYugoslavianYumanYup'ikZimbabwean
Immigration
NonimmigrantsImmigrantsAfghanistanAfricaAlbaniaArgentinaArmeniaAsiaAustraliaAustriaBahamasBangladeshBarbadosBelarusBelgiumBelizeBoliviaBosnia and HerzegovinaBrazilBulgariaBurma/MyanmarCabo VerdeCambodiaCameroonCanadaCaribbeanCentral AmericaChileChinaColombiaCongoCosta RicaCroatiaCubaCzechoslovakiaDenmarkDominicaDominican RepublicEastern AfricaEastern AsiaEastern EuropeEcuadorEgyptEl SalvadorEnglandEritreaEthiopiaEuropeFijiFranceGermanyGhanaGreeceGrenadaGuatemalaGuyanaHaitiHondurasHong KongHungaryIndiaIndonesiaIranIraqIrelandIsraelItalyJamaicaJapanJordanKazakhstanKenyaKoreaKuwaitLaosLatin AmericaLatviaLebanonLiberiaLithuaniaMalaysiaMexicoMicronesiaMiddle AfricaMoldovaMoroccoNepalNetherlandsNicaraguaNigeriaNorth AmericaNorth MacedoniaNorthern AfricaNorthern EuropeNorwayOceaniaPakistanPanamaPeruPhilippinesPolandPortugalRomaniaRussiaSaudi ArabiaScotlandSenegalSerbiaSierra LeoneSingaporeSomaliaSouth AfricaSouth AmericaSouth Central AsiaSouth Eastern AsiaSouthern EuropeSpainSri LankaSt. Vincent and the GrenadinesSudanSwedenSwitzerlandSyriaTaiwanThailandTrinidad and TobagoTurkeyUgandaUkraineUruguayUzbekistanVenezuelaVietnamWest IndiesWestern AfricaWestern AsiaWestern EuropeYemenZaireZimbabweAzores
Professional Degree
Income
Poverty
Unemployment
Labor Participation
Family Structure
Vehicle Availability
Education Level
Disability

Professional Degree Comparison

Sub-Saharan Africans

Immigrants from France

Poor
Exceptional
4.1%
PROFESSIONAL DEGREE
12.8/ 100
METRIC RATING
207th/ 347
METRIC RANK
6.8%
PROFESSIONAL DEGREE
100.0/ 100
METRIC RATING
14th/ 347
METRIC RANK

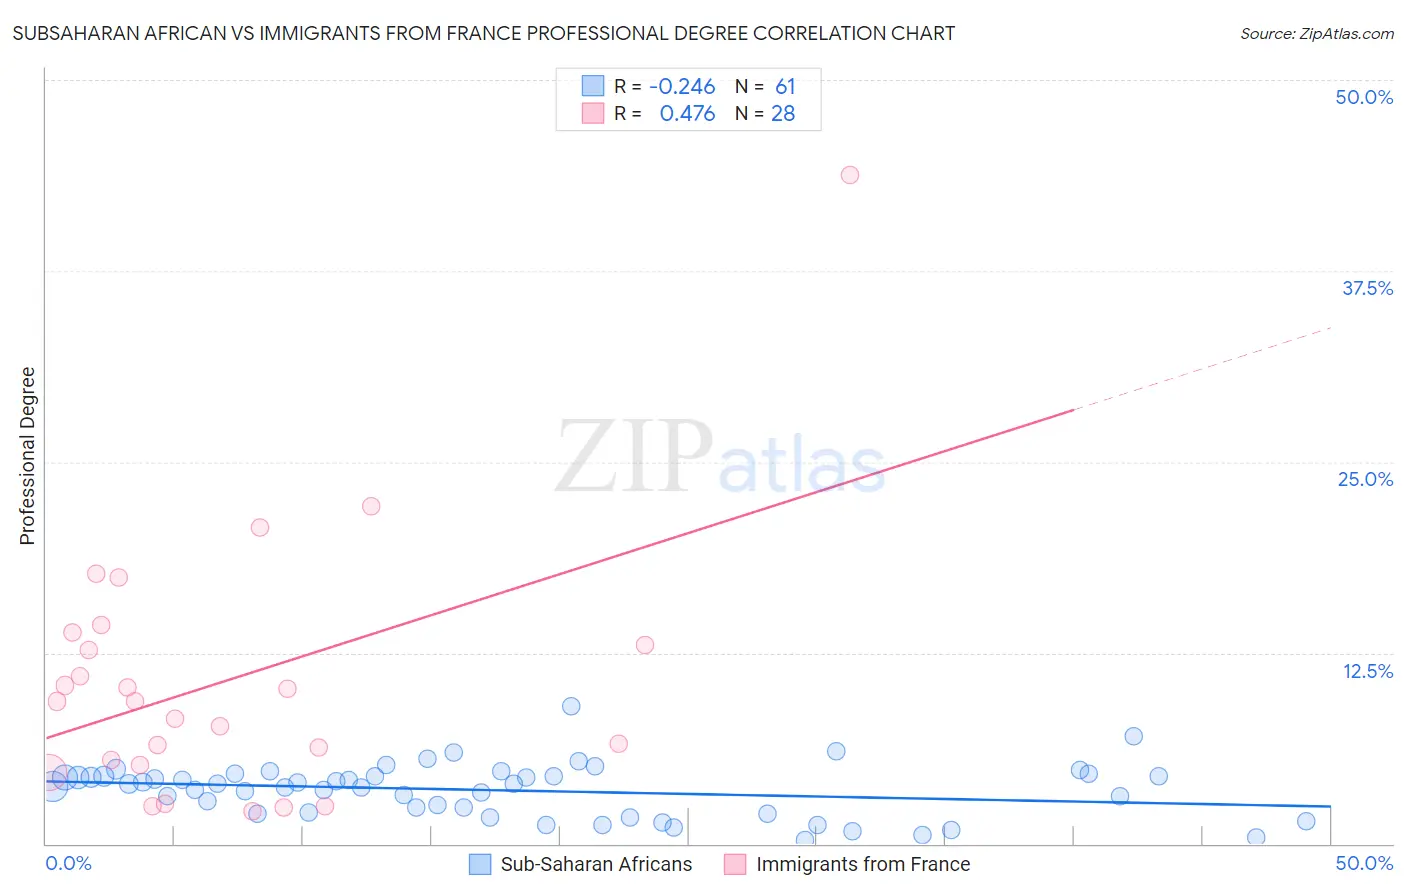
Subsaharan African vs Immigrants from France Professional Degree Correlation Chart

The statistical analysis conducted on geographies consisting of 505,148,465 people shows a weak negative correlation between the proportion of Sub-Saharan Africans and percentage of population with at least professional degree education in the United States with a correlation coefficient (R) of -0.246 and weighted average of 4.1%. Similarly, the statistical analysis conducted on geographies consisting of 287,646,989 people shows a moderate positive correlation between the proportion of Immigrants from France and percentage of population with at least professional degree education in the United States with a correlation coefficient (R) of 0.476 and weighted average of 6.8%, a difference of 65.9%.
Subsaharan African vs Immigrants from France Professional Degree

Professional Degree Correlation Summary

MeasurementSubsaharan AfricanImmigrants from France
Minimum0.23%2.1%
Maximum9.0%43.8%
Range8.8%41.6%
Mean3.5%10.7%
Median3.9%9.3%
Interquartile 25% (IQ1)2.0%5.3%
Interquartile 75% (IQ3)4.4%13.5%
Interquartile Range (IQR)2.4%8.1%
Standard Deviation (Sample)1.7%8.5%
Standard Deviation (Population)1.7%8.4%

Similar Demographics by Professional Degree

Demographics Similar to Sub-Saharan Africans by Professional Degree

In terms of professional degree, the demographic groups most similar to Sub-Saharan Africans are Immigrants from Somalia (4.1%, a difference of 0.080%), Immigrants from Panama (4.1%, a difference of 0.16%), Yugoslavian (4.1%, a difference of 0.24%), Immigrants from Nigeria (4.1%, a difference of 0.38%), and German (4.1%, a difference of 0.42%).
DemographicsRating | RankProfessional Degree
Immigrants | North Macedonia
20.2
/100
|
#200
Fair
4.2%
Finns
18.7
/100
|
#201
Poor
4.2%
Immigrants | Iraq
17.1
/100
|
#202
Poor
4.2%
Panamanians
15.9
/100
|
#203
Poor
4.1%
Barbadians
15.8
/100
|
#204
Poor
4.1%
Somalis
14.8
/100
|
#205
Poor
4.1%
Yugoslavians
13.4
/100
|
#206
Poor
4.1%
Sub-Saharan Africans
12.8
/100
|
#207
Poor
4.1%
Immigrants | Somalia
12.5
/100
|
#208
Poor
4.1%
Immigrants | Panama
12.3
/100
|
#209
Poor
4.1%
Immigrants | Nigeria
11.7
/100
|
#210
Poor
4.1%
Germans
11.6
/100
|
#211
Poor
4.1%
Whites/Caucasians
11.2
/100
|
#212
Poor
4.1%
Koreans
10.7
/100
|
#213
Poor
4.1%
Immigrants | Ghana
10.6
/100
|
#214
Poor
4.1%

Demographics Similar to Immigrants from France by Professional Degree

In terms of professional degree, the demographic groups most similar to Immigrants from France are Immigrants from China (6.7%, a difference of 1.1%), Immigrants from Australia (6.9%, a difference of 1.5%), Immigrants from Sweden (6.7%, a difference of 1.5%), Israeli (6.9%, a difference of 1.9%), and Cypriot (6.9%, a difference of 2.0%).
DemographicsRating | RankProfessional Degree
Eastern Europeans
100.0
/100
|
#7
Exceptional
7.1%
Immigrants | Switzerland
100.0
/100
|
#8
Exceptional
7.1%
Immigrants | Taiwan
100.0
/100
|
#9
Exceptional
7.1%
Immigrants | Belgium
100.0
/100
|
#10
Exceptional
7.0%
Cypriots
100.0
/100
|
#11
Exceptional
6.9%
Israelis
100.0
/100
|
#12
Exceptional
6.9%
Immigrants | Australia
100.0
/100
|
#13
Exceptional
6.9%
Immigrants | France
100.0
/100
|
#14
Exceptional
6.8%
Immigrants | China
100.0
/100
|
#15
Exceptional
6.7%
Immigrants | Sweden
100.0
/100
|
#16
Exceptional
6.7%
Immigrants | Eastern Asia
100.0
/100
|
#17
Exceptional
6.6%
Soviet Union
100.0
/100
|
#18
Exceptional
6.6%
Indians (Asian)
100.0
/100
|
#19
Exceptional
6.5%
Immigrants | Denmark
100.0
/100
|
#20
Exceptional
6.4%
Immigrants | Hong Kong
100.0
/100
|
#21
Exceptional
6.4%