Canadian vs Trinidadian and Tobagonian Professional Degree
COMPARE
Canadian
Trinidadian and Tobagonian
Professional Degree
Professional Degree Comparison
Canadians
Trinidadians and Tobagonians
4.7%
PROFESSIONAL DEGREE
84.4/ 100
METRIC RATING
140th/ 347
METRIC RANK
4.0%
PROFESSIONAL DEGREE
7.1/ 100
METRIC RATING
224th/ 347
METRIC RANK
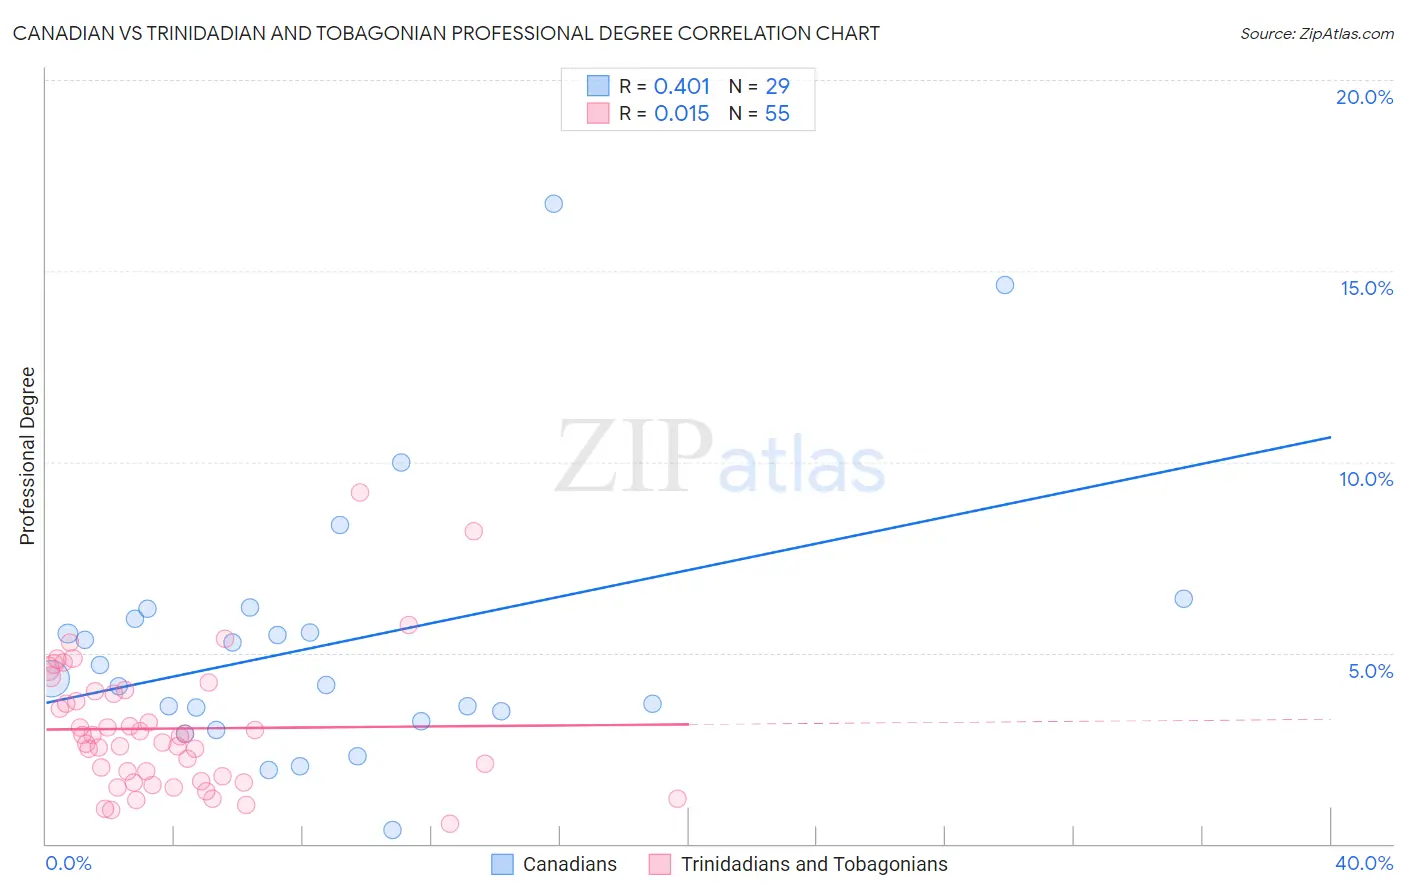
Canadian vs Trinidadian and Tobagonian Professional Degree Correlation Chart
The statistical analysis conducted on geographies consisting of 436,022,571 people shows a moderate positive correlation between the proportion of Canadians and percentage of population with at least professional degree education in the United States with a correlation coefficient (R) of 0.401 and weighted average of 4.7%. Similarly, the statistical analysis conducted on geographies consisting of 219,572,491 people shows no correlation between the proportion of Trinidadians and Tobagonians and percentage of population with at least professional degree education in the United States with a correlation coefficient (R) of 0.015 and weighted average of 4.0%, a difference of 17.0%.
Professional Degree Correlation Summary
| Measurement | Canadian | Trinidadian and Tobagonian |
| Minimum | 0.35% | 0.53% |
| Maximum | 16.8% | 9.2% |
| Range | 16.4% | 8.7% |
| Mean | 5.3% | 3.0% |
| Median | 4.3% | 2.8% |
| Interquartile 25% (IQ1) | 3.3% | 1.6% |
| Interquartile 75% (IQ3) | 6.0% | 4.0% |
| Interquartile Range (IQR) | 2.7% | 2.4% |
| Standard Deviation (Sample) | 3.5% | 1.7% |
| Standard Deviation (Population) | 3.4% | 1.7% |
Similar Demographics by Professional Degree
Demographics Similar to Canadians by Professional Degree
In terms of professional degree, the demographic groups most similar to Canadians are South American (4.7%, a difference of 0.34%), Basque (4.6%, a difference of 0.62%), Sudanese (4.6%, a difference of 0.75%), Hungarian (4.6%, a difference of 0.86%), and Immigrants from South America (4.6%, a difference of 0.93%).
| Demographics | Rating | Rank | Professional Degree |
| Italians | 90.2 /100 | #133 | Exceptional 4.8% |
| South American Indians | 89.9 /100 | #134 | Excellent 4.8% |
| Macedonians | 89.8 /100 | #135 | Excellent 4.8% |
| Immigrants | Jordan | 89.0 /100 | #136 | Excellent 4.7% |
| Jordanians | 88.9 /100 | #137 | Excellent 4.7% |
| Afghans | 88.8 /100 | #138 | Excellent 4.7% |
| South Americans | 85.6 /100 | #139 | Excellent 4.7% |
| Canadians | 84.4 /100 | #140 | Excellent 4.7% |
| Basques | 81.8 /100 | #141 | Excellent 4.6% |
| Sudanese | 81.3 /100 | #142 | Excellent 4.6% |
| Hungarians | 80.8 /100 | #143 | Excellent 4.6% |
| Immigrants | South America | 80.5 /100 | #144 | Excellent 4.6% |
| Uruguayans | 80.2 /100 | #145 | Excellent 4.6% |
| Luxembourgers | 78.7 /100 | #146 | Good 4.6% |
| Colombians | 77.7 /100 | #147 | Good 4.6% |
Demographics Similar to Trinidadians and Tobagonians by Professional Degree
In terms of professional degree, the demographic groups most similar to Trinidadians and Tobagonians are Tlingit-Haida (4.0%, a difference of 0.13%), Immigrants from Bosnia and Herzegovina (4.0%, a difference of 0.14%), Immigrants from Western Africa (4.0%, a difference of 0.22%), French Canadian (4.0%, a difference of 0.47%), and Ute (4.0%, a difference of 0.60%).
| Demographics | Rating | Rank | Professional Degree |
| Immigrants | Vietnam | 9.4 /100 | #217 | Tragic 4.0% |
| Dutch | 9.0 /100 | #218 | Tragic 4.0% |
| Immigrants | South Eastern Asia | 8.9 /100 | #219 | Tragic 4.0% |
| Ute | 8.2 /100 | #220 | Tragic 4.0% |
| French Canadians | 8.0 /100 | #221 | Tragic 4.0% |
| Immigrants | Western Africa | 7.5 /100 | #222 | Tragic 4.0% |
| Immigrants | Bosnia and Herzegovina | 7.4 /100 | #223 | Tragic 4.0% |
| Trinidadians and Tobagonians | 7.1 /100 | #224 | Tragic 4.0% |
| Tlingit-Haida | 6.9 /100 | #225 | Tragic 4.0% |
| German Russians | 6.1 /100 | #226 | Tragic 4.0% |
| Cubans | 5.9 /100 | #227 | Tragic 4.0% |
| Immigrants | West Indies | 5.6 /100 | #228 | Tragic 4.0% |
| Immigrants | Burma/Myanmar | 5.4 /100 | #229 | Tragic 3.9% |
| Nicaraguans | 5.1 /100 | #230 | Tragic 3.9% |
| Ecuadorians | 4.6 /100 | #231 | Tragic 3.9% |