Central American Indian vs Trinidadian and Tobagonian Doctorate Degree
COMPARE
Central American Indian
Trinidadian and Tobagonian
Doctorate Degree
Doctorate Degree Comparison
Central American Indians
Trinidadians and Tobagonians
1.5%
DOCTORATE DEGREE
1.0/ 100
METRIC RATING
256th/ 347
METRIC RANK
1.5%
DOCTORATE DEGREE
1.0/ 100
METRIC RATING
255th/ 347
METRIC RANK
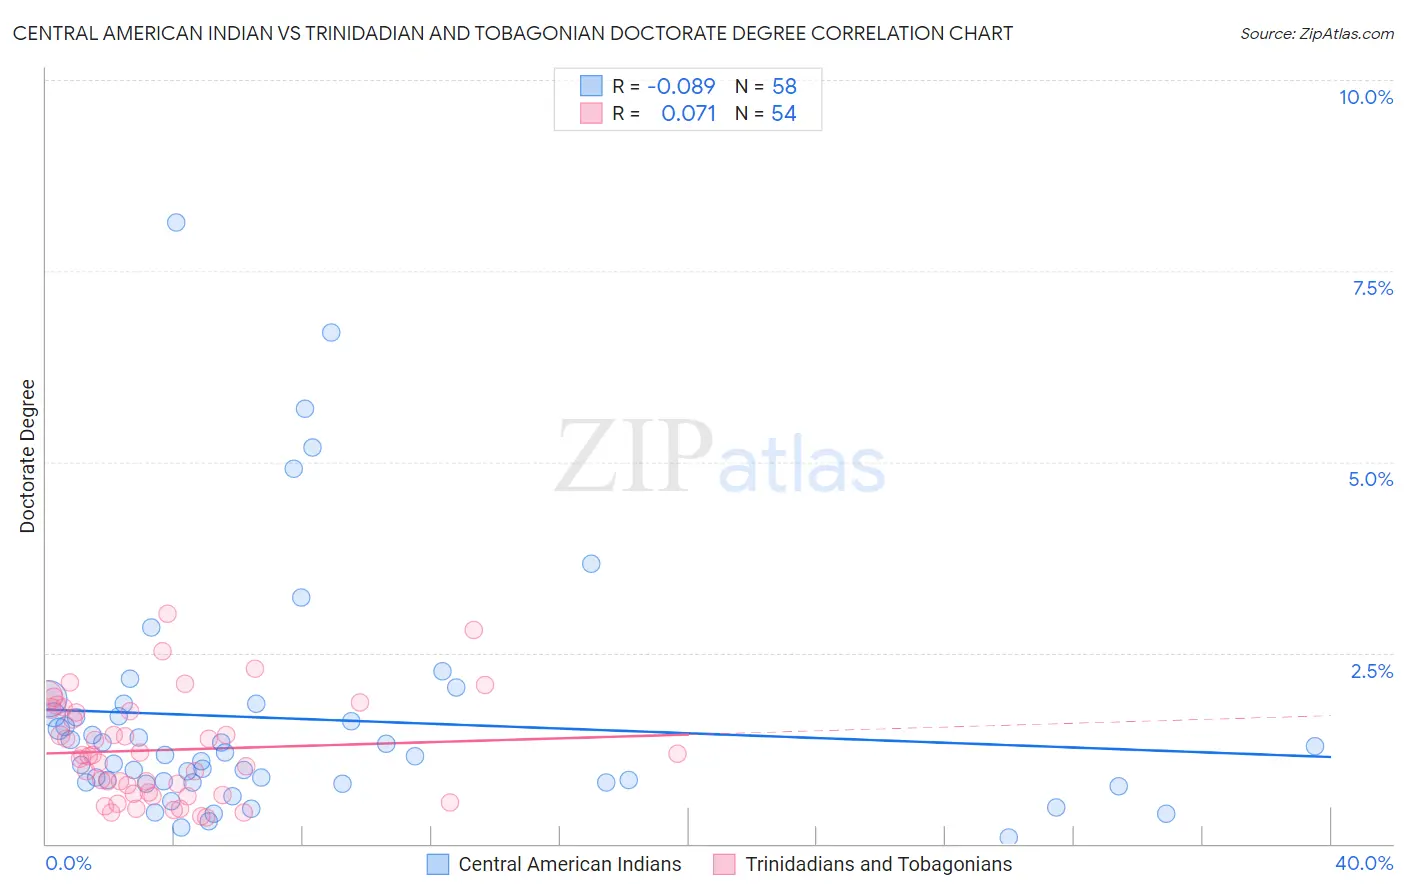
Central American Indian vs Trinidadian and Tobagonian Doctorate Degree Correlation Chart
The statistical analysis conducted on geographies consisting of 323,048,918 people shows a slight negative correlation between the proportion of Central American Indians and percentage of population with at least doctorate degree education in the United States with a correlation coefficient (R) of -0.089 and weighted average of 1.5%. Similarly, the statistical analysis conducted on geographies consisting of 218,914,311 people shows a slight positive correlation between the proportion of Trinidadians and Tobagonians and percentage of population with at least doctorate degree education in the United States with a correlation coefficient (R) of 0.071 and weighted average of 1.5%, a difference of 0.050%.
Doctorate Degree Correlation Summary
| Measurement | Central American Indian | Trinidadian and Tobagonian |
| Minimum | 0.089% | 0.35% |
| Maximum | 8.1% | 3.0% |
| Range | 8.0% | 2.7% |
| Mean | 1.6% | 1.2% |
| Median | 1.2% | 1.2% |
| Interquartile 25% (IQ1) | 0.81% | 0.65% |
| Interquartile 75% (IQ3) | 1.7% | 1.7% |
| Interquartile Range (IQR) | 0.88% | 1.1% |
| Standard Deviation (Sample) | 1.6% | 0.66% |
| Standard Deviation (Population) | 1.6% | 0.65% |
Demographics Similar to Central American Indians and Trinidadians and Tobagonians by Doctorate Degree
In terms of doctorate degree, the demographic groups most similar to Central American Indians are Immigrants from Cambodia (1.5%, a difference of 0.050%), American (1.5%, a difference of 0.18%), Chippewa (1.5%, a difference of 0.22%), Yuman (1.5%, a difference of 0.33%), and Immigrants from West Indies (1.5%, a difference of 0.48%). Similarly, the demographic groups most similar to Trinidadians and Tobagonians are Immigrants from Cambodia (1.5%, a difference of 0.010%), American (1.5%, a difference of 0.13%), Chippewa (1.5%, a difference of 0.27%), Yuman (1.5%, a difference of 0.28%), and Immigrants from West Indies (1.5%, a difference of 0.53%).
| Demographics | Rating | Rank | Doctorate Degree |
| Delaware | 1.9 /100 | #245 | Tragic 1.6% |
| Hmong | 1.8 /100 | #246 | Tragic 1.6% |
| Comanche | 1.8 /100 | #247 | Tragic 1.6% |
| Africans | 1.8 /100 | #248 | Tragic 1.6% |
| Potawatomi | 1.6 /100 | #249 | Tragic 1.6% |
| Immigrants | Fiji | 1.6 /100 | #250 | Tragic 1.6% |
| Apache | 1.3 /100 | #251 | Tragic 1.5% |
| Yuman | 1.1 /100 | #252 | Tragic 1.5% |
| Americans | 1.0 /100 | #253 | Tragic 1.5% |
| Immigrants | Cambodia | 1.0 /100 | #254 | Tragic 1.5% |
| Trinidadians and Tobagonians | 1.0 /100 | #255 | Tragic 1.5% |
| Central American Indians | 1.0 /100 | #256 | Tragic 1.5% |
| Chippewa | 0.9 /100 | #257 | Tragic 1.5% |
| Immigrants | West Indies | 0.9 /100 | #258 | Tragic 1.5% |
| Liberians | 0.9 /100 | #259 | Tragic 1.5% |
| Japanese | 0.9 /100 | #260 | Tragic 1.5% |
| Immigrants | Portugal | 0.8 /100 | #261 | Tragic 1.5% |
| Chickasaw | 0.7 /100 | #262 | Tragic 1.5% |
| Immigrants | Bahamas | 0.7 /100 | #263 | Tragic 1.5% |
| Blackfeet | 0.7 /100 | #264 | Tragic 1.5% |
| Nicaraguans | 0.6 /100 | #265 | Tragic 1.5% |