Subsaharan African vs Tohono O'odham 4 or more Vehicles in Household
COMPARE
Subsaharan African
Tohono O'odham
4 or more Vehicles in Household
4 or more Vehicles in Household Comparison
Sub-Saharan Africans
Tohono O'odham
5.7%
4 OR MORE VEHICLES IN HOUSEHOLD
2.1/ 100
METRIC RATING
252nd/ 347
METRIC RANK
6.6%
4 OR MORE VEHICLES IN HOUSEHOLD
86.7/ 100
METRIC RATING
135th/ 347
METRIC RANK
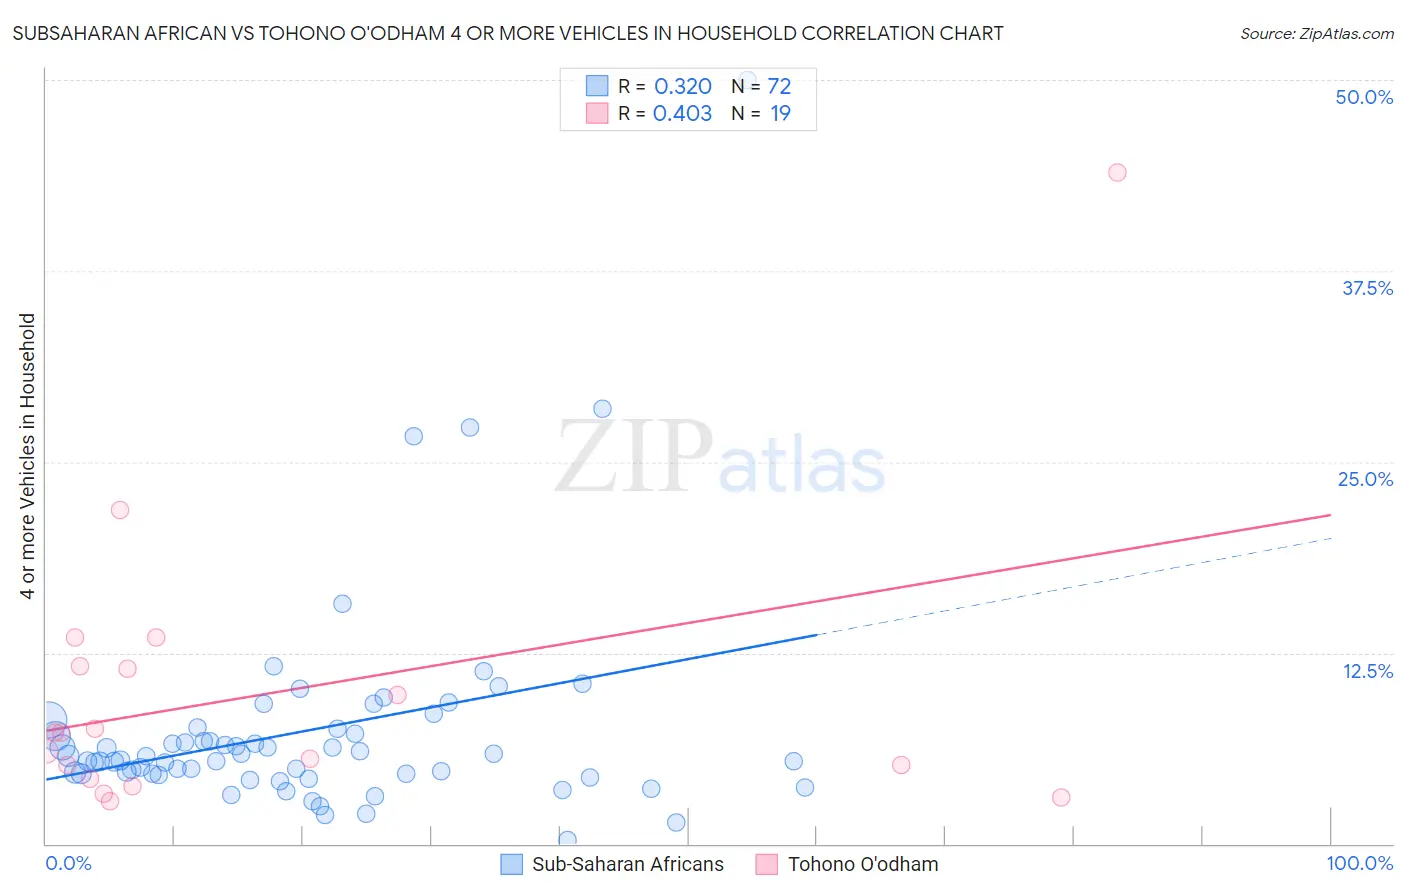
Subsaharan African vs Tohono O'odham 4 or more Vehicles in Household Correlation Chart
The statistical analysis conducted on geographies consisting of 505,333,507 people shows a mild positive correlation between the proportion of Sub-Saharan Africans and percentage of households with 4 or more vehicles available in the United States with a correlation coefficient (R) of 0.320 and weighted average of 5.7%. Similarly, the statistical analysis conducted on geographies consisting of 58,702,005 people shows a moderate positive correlation between the proportion of Tohono O'odham and percentage of households with 4 or more vehicles available in the United States with a correlation coefficient (R) of 0.403 and weighted average of 6.6%, a difference of 16.1%.
4 or more Vehicles in Household Correlation Summary
| Measurement | Subsaharan African | Tohono O'odham |
| Minimum | 0.25% | 2.8% |
| Maximum | 50.0% | 43.9% |
| Range | 49.8% | 41.1% |
| Mean | 7.4% | 9.8% |
| Median | 5.6% | 7.3% |
| Interquartile 25% (IQ1) | 4.6% | 4.3% |
| Interquartile 75% (IQ3) | 7.4% | 11.6% |
| Interquartile Range (IQR) | 2.8% | 7.3% |
| Standard Deviation (Sample) | 7.2% | 9.5% |
| Standard Deviation (Population) | 7.1% | 9.3% |
Similar Demographics by 4 or more Vehicles in Household
Demographics Similar to Sub-Saharan Africans by 4 or more Vehicles in Household
In terms of 4 or more vehicles in household, the demographic groups most similar to Sub-Saharan Africans are Ugandan (5.7%, a difference of 0.23%), Immigrants from Europe (5.7%, a difference of 0.25%), Immigrants from Southern Europe (5.7%, a difference of 0.35%), Immigrants from Eastern Africa (5.7%, a difference of 0.37%), and Immigrants from Ethiopia (5.7%, a difference of 0.48%).
| Demographics | Rating | Rank | 4 or more Vehicles in Household |
| Bulgarians | 3.1 /100 | #245 | Tragic 5.8% |
| Immigrants | North Macedonia | 2.5 /100 | #246 | Tragic 5.7% |
| Immigrants | Ethiopia | 2.4 /100 | #247 | Tragic 5.7% |
| Immigrants | Eastern Africa | 2.4 /100 | #248 | Tragic 5.7% |
| Immigrants | Southern Europe | 2.3 /100 | #249 | Tragic 5.7% |
| Immigrants | Europe | 2.3 /100 | #250 | Tragic 5.7% |
| Ugandans | 2.2 /100 | #251 | Tragic 5.7% |
| Sub-Saharan Africans | 2.1 /100 | #252 | Tragic 5.7% |
| Immigrants | Cuba | 1.6 /100 | #253 | Tragic 5.7% |
| Immigrants | Panama | 1.5 /100 | #254 | Tragic 5.7% |
| Yup'ik | 1.5 /100 | #255 | Tragic 5.7% |
| Immigrants | Turkey | 1.5 /100 | #256 | Tragic 5.7% |
| Immigrants | Northern Africa | 1.4 /100 | #257 | Tragic 5.6% |
| Immigrants | Lithuania | 1.4 /100 | #258 | Tragic 5.6% |
| Immigrants | France | 1.3 /100 | #259 | Tragic 5.6% |
Demographics Similar to Tohono O'odham by 4 or more Vehicles in Household
In terms of 4 or more vehicles in household, the demographic groups most similar to Tohono O'odham are Ottawa (6.6%, a difference of 0.030%), Armenian (6.6%, a difference of 0.050%), Luxembourger (6.6%, a difference of 0.070%), Immigrants from Netherlands (6.6%, a difference of 0.24%), and French Canadian (6.6%, a difference of 0.27%).
| Demographics | Rating | Rank | 4 or more Vehicles in Household |
| Immigrants | Bolivia | 92.5 /100 | #128 | Exceptional 6.7% |
| Immigrants | England | 92.0 /100 | #129 | Exceptional 6.7% |
| Immigrants | Scotland | 89.0 /100 | #130 | Excellent 6.7% |
| Maltese | 88.4 /100 | #131 | Excellent 6.7% |
| Immigrants | Netherlands | 87.8 /100 | #132 | Excellent 6.6% |
| Armenians | 86.9 /100 | #133 | Excellent 6.6% |
| Ottawa | 86.9 /100 | #134 | Excellent 6.6% |
| Tohono O'odham | 86.7 /100 | #135 | Excellent 6.6% |
| Luxembourgers | 86.4 /100 | #136 | Excellent 6.6% |
| French Canadians | 85.4 /100 | #137 | Excellent 6.6% |
| Italians | 84.5 /100 | #138 | Excellent 6.6% |
| Jordanians | 82.1 /100 | #139 | Excellent 6.6% |
| Slavs | 81.6 /100 | #140 | Excellent 6.6% |
| Australians | 80.8 /100 | #141 | Excellent 6.6% |
| Immigrants | Iraq | 79.4 /100 | #142 | Good 6.5% |