Puerto Rican vs Immigrants from Trinidad and Tobago 6th Grade
COMPARE
Puerto Rican
Immigrants from Trinidad and Tobago
6th Grade
6th Grade Comparison
Puerto Ricans
Immigrants from Trinidad and Tobago
95.5%
6TH GRADE
0.0/ 100
METRIC RATING
309th/ 347
METRIC RANK
96.2%
6TH GRADE
0.0/ 100
METRIC RATING
287th/ 347
METRIC RANK
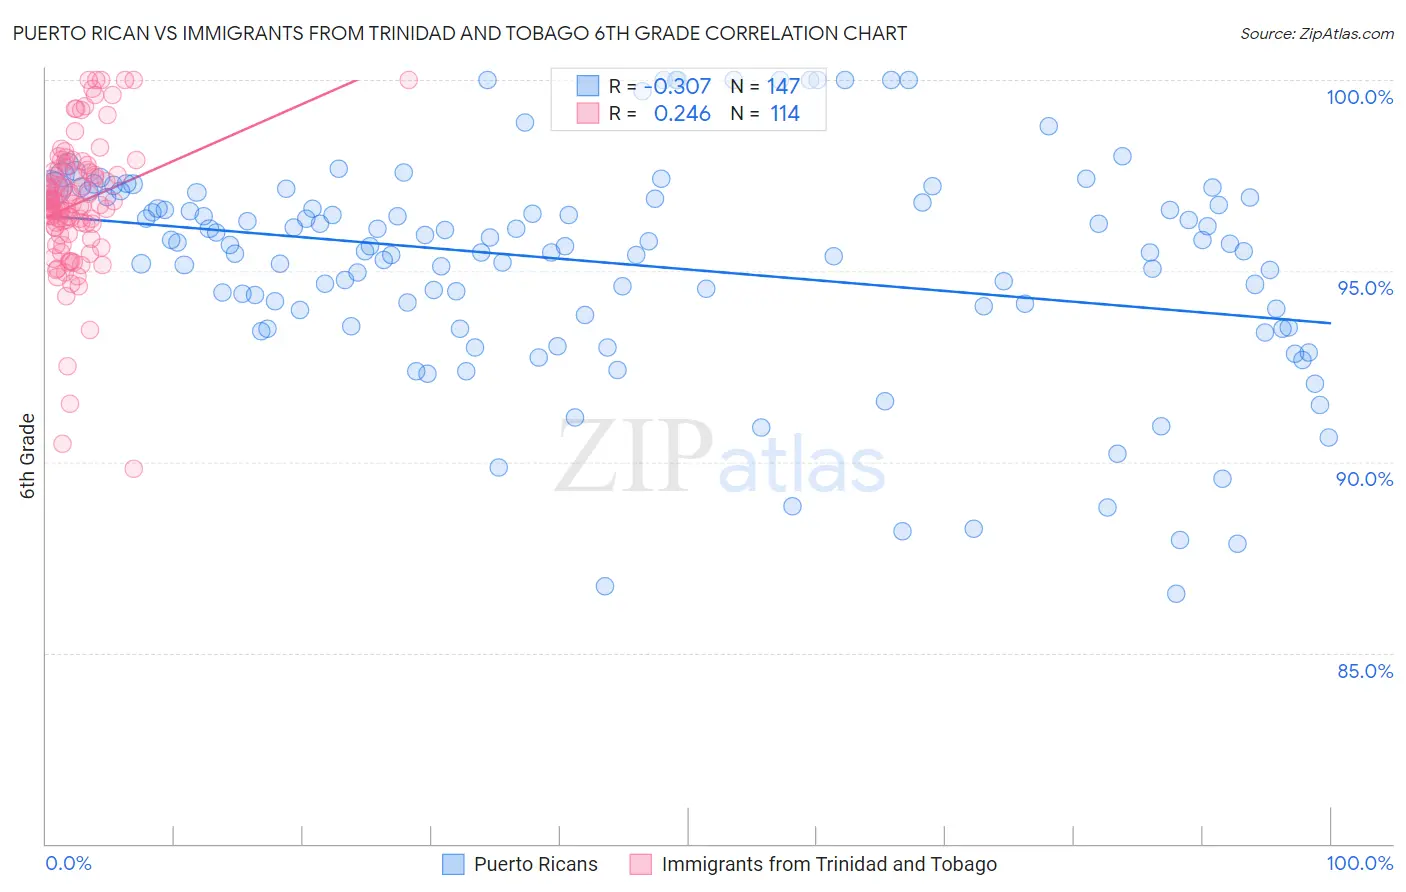
Puerto Rican vs Immigrants from Trinidad and Tobago 6th Grade Correlation Chart
The statistical analysis conducted on geographies consisting of 528,320,438 people shows a mild negative correlation between the proportion of Puerto Ricans and percentage of population with at least 6th grade education in the United States with a correlation coefficient (R) of -0.307 and weighted average of 95.5%. Similarly, the statistical analysis conducted on geographies consisting of 223,526,834 people shows a weak positive correlation between the proportion of Immigrants from Trinidad and Tobago and percentage of population with at least 6th grade education in the United States with a correlation coefficient (R) of 0.246 and weighted average of 96.2%, a difference of 0.69%.
6th Grade Correlation Summary
| Measurement | Puerto Rican | Immigrants from Trinidad and Tobago |
| Minimum | 86.6% | 89.8% |
| Maximum | 100.0% | 100.0% |
| Range | 13.4% | 10.2% |
| Mean | 95.2% | 96.8% |
| Median | 95.7% | 96.7% |
| Interquartile 25% (IQ1) | 93.8% | 96.1% |
| Interquartile 75% (IQ3) | 96.9% | 97.6% |
| Interquartile Range (IQR) | 3.1% | 1.5% |
| Standard Deviation (Sample) | 2.9% | 1.8% |
| Standard Deviation (Population) | 2.8% | 1.8% |
Similar Demographics by 6th Grade
Demographics Similar to Puerto Ricans by 6th Grade
In terms of 6th grade, the demographic groups most similar to Puerto Ricans are Ecuadorian (95.5%, a difference of 0.010%), Immigrants from Portugal (95.5%, a difference of 0.030%), Immigrants from Guyana (95.5%, a difference of 0.040%), Immigrants from Caribbean (95.6%, a difference of 0.050%), and Guyanese (95.6%, a difference of 0.060%).
| Demographics | Rating | Rank | 6th Grade |
| Immigrants | Burma/Myanmar | 0.0 /100 | #302 | Tragic 95.7% |
| Bangladeshis | 0.0 /100 | #303 | Tragic 95.7% |
| Indonesians | 0.0 /100 | #304 | Tragic 95.6% |
| Immigrants | Cuba | 0.0 /100 | #305 | Tragic 95.6% |
| Immigrants | Haiti | 0.0 /100 | #306 | Tragic 95.6% |
| Guyanese | 0.0 /100 | #307 | Tragic 95.6% |
| Immigrants | Caribbean | 0.0 /100 | #308 | Tragic 95.6% |
| Puerto Ricans | 0.0 /100 | #309 | Tragic 95.5% |
| Ecuadorians | 0.0 /100 | #310 | Tragic 95.5% |
| Immigrants | Portugal | 0.0 /100 | #311 | Tragic 95.5% |
| Immigrants | Guyana | 0.0 /100 | #312 | Tragic 95.5% |
| Nicaraguans | 0.0 /100 | #313 | Tragic 95.4% |
| Immigrants | Vietnam | 0.0 /100 | #314 | Tragic 95.4% |
| Immigrants | Bangladesh | 0.0 /100 | #315 | Tragic 95.4% |
| Japanese | 0.0 /100 | #316 | Tragic 95.4% |
Demographics Similar to Immigrants from Trinidad and Tobago by 6th Grade
In terms of 6th grade, the demographic groups most similar to Immigrants from Trinidad and Tobago are Barbadian (96.2%, a difference of 0.010%), Malaysian (96.2%, a difference of 0.010%), Immigrants from Eritrea (96.1%, a difference of 0.030%), Somali (96.2%, a difference of 0.040%), and Fijian (96.2%, a difference of 0.050%).
| Demographics | Rating | Rank | 6th Grade |
| Immigrants | Afghanistan | 0.1 /100 | #280 | Tragic 96.2% |
| Trinidadians and Tobagonians | 0.1 /100 | #281 | Tragic 96.2% |
| Houma | 0.1 /100 | #282 | Tragic 96.2% |
| Cubans | 0.1 /100 | #283 | Tragic 96.2% |
| Fijians | 0.1 /100 | #284 | Tragic 96.2% |
| Somalis | 0.1 /100 | #285 | Tragic 96.2% |
| Barbadians | 0.0 /100 | #286 | Tragic 96.2% |
| Immigrants | Trinidad and Tobago | 0.0 /100 | #287 | Tragic 96.2% |
| Malaysians | 0.0 /100 | #288 | Tragic 96.2% |
| Immigrants | Eritrea | 0.0 /100 | #289 | Tragic 96.1% |
| Immigrants | Somalia | 0.0 /100 | #290 | Tragic 96.1% |
| Immigrants | St. Vincent and the Grenadines | 0.0 /100 | #291 | Tragic 96.1% |
| Immigrants | Barbados | 0.0 /100 | #292 | Tragic 96.1% |
| Immigrants | West Indies | 0.0 /100 | #293 | Tragic 96.1% |
| British West Indians | 0.0 /100 | #294 | Tragic 96.0% |