Immigrants from Honduras vs Immigrants from Trinidad and Tobago 6th Grade
COMPARE
Immigrants from Honduras
Immigrants from Trinidad and Tobago
6th Grade
6th Grade Comparison
Immigrants from Honduras
Immigrants from Trinidad and Tobago
94.8%
6TH GRADE
0.0/ 100
METRIC RATING
332nd/ 347
METRIC RANK
96.2%
6TH GRADE
0.0/ 100
METRIC RATING
287th/ 347
METRIC RANK
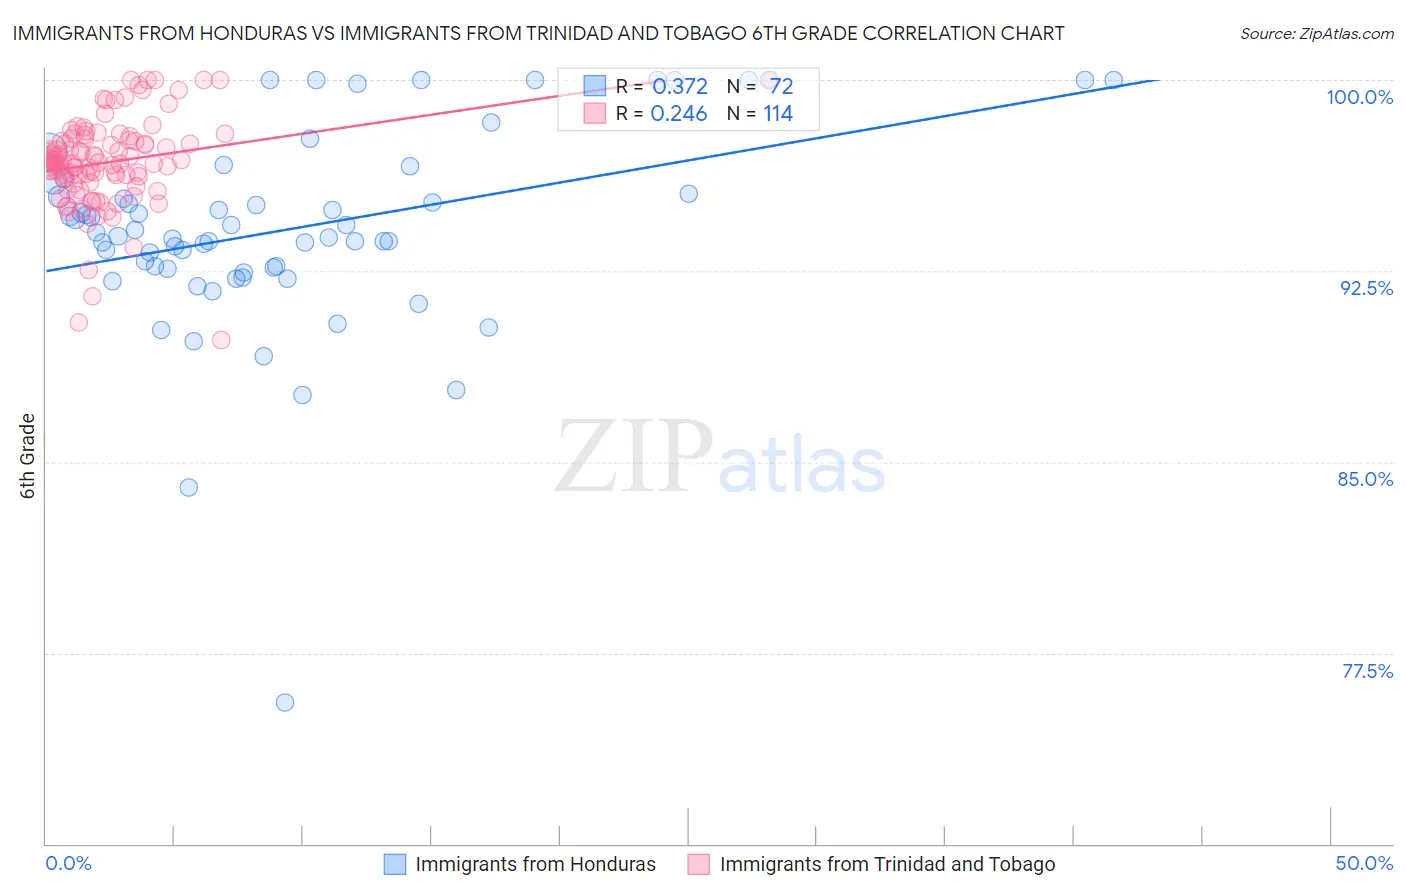
Immigrants from Honduras vs Immigrants from Trinidad and Tobago 6th Grade Correlation Chart
The statistical analysis conducted on geographies consisting of 322,637,445 people shows a mild positive correlation between the proportion of Immigrants from Honduras and percentage of population with at least 6th grade education in the United States with a correlation coefficient (R) of 0.372 and weighted average of 94.8%. Similarly, the statistical analysis conducted on geographies consisting of 223,526,834 people shows a weak positive correlation between the proportion of Immigrants from Trinidad and Tobago and percentage of population with at least 6th grade education in the United States with a correlation coefficient (R) of 0.246 and weighted average of 96.2%, a difference of 1.5%.
6th Grade Correlation Summary
| Measurement | Immigrants from Honduras | Immigrants from Trinidad and Tobago |
| Minimum | 75.6% | 89.8% |
| Maximum | 100.0% | 100.0% |
| Range | 24.4% | 10.2% |
| Mean | 94.2% | 96.8% |
| Median | 93.9% | 96.7% |
| Interquartile 25% (IQ1) | 92.6% | 96.1% |
| Interquartile 75% (IQ3) | 95.8% | 97.6% |
| Interquartile Range (IQR) | 3.2% | 1.5% |
| Standard Deviation (Sample) | 4.0% | 1.8% |
| Standard Deviation (Population) | 3.9% | 1.8% |
Similar Demographics by 6th Grade
Demographics Similar to Immigrants from Honduras by 6th Grade
In terms of 6th grade, the demographic groups most similar to Immigrants from Honduras are Immigrants from Latin America (94.7%, a difference of 0.080%), Immigrants from Armenia (94.9%, a difference of 0.10%), Immigrants from the Azores (94.7%, a difference of 0.10%), Nepalese (94.9%, a difference of 0.11%), and Mexican (94.6%, a difference of 0.12%).
| Demographics | Rating | Rank | 6th Grade |
| Immigrants | Nicaragua | 0.0 /100 | #325 | Tragic 95.1% |
| Hispanics or Latinos | 0.0 /100 | #326 | Tragic 95.0% |
| Mexican American Indians | 0.0 /100 | #327 | Tragic 95.0% |
| Hondurans | 0.0 /100 | #328 | Tragic 95.0% |
| Dominicans | 0.0 /100 | #329 | Tragic 94.9% |
| Nepalese | 0.0 /100 | #330 | Tragic 94.9% |
| Immigrants | Armenia | 0.0 /100 | #331 | Tragic 94.9% |
| Immigrants | Honduras | 0.0 /100 | #332 | Tragic 94.8% |
| Immigrants | Latin America | 0.0 /100 | #333 | Tragic 94.7% |
| Immigrants | Azores | 0.0 /100 | #334 | Tragic 94.7% |
| Mexicans | 0.0 /100 | #335 | Tragic 94.6% |
| Immigrants | Dominican Republic | 0.0 /100 | #336 | Tragic 94.6% |
| Central Americans | 0.0 /100 | #337 | Tragic 94.5% |
| Immigrants | Cabo Verde | 0.0 /100 | #338 | Tragic 94.4% |
| Yakama | 0.0 /100 | #339 | Tragic 94.3% |
Demographics Similar to Immigrants from Trinidad and Tobago by 6th Grade
In terms of 6th grade, the demographic groups most similar to Immigrants from Trinidad and Tobago are Barbadian (96.2%, a difference of 0.010%), Malaysian (96.2%, a difference of 0.010%), Immigrants from Eritrea (96.1%, a difference of 0.030%), Somali (96.2%, a difference of 0.040%), and Fijian (96.2%, a difference of 0.050%).
| Demographics | Rating | Rank | 6th Grade |
| Immigrants | Afghanistan | 0.1 /100 | #280 | Tragic 96.2% |
| Trinidadians and Tobagonians | 0.1 /100 | #281 | Tragic 96.2% |
| Houma | 0.1 /100 | #282 | Tragic 96.2% |
| Cubans | 0.1 /100 | #283 | Tragic 96.2% |
| Fijians | 0.1 /100 | #284 | Tragic 96.2% |
| Somalis | 0.1 /100 | #285 | Tragic 96.2% |
| Barbadians | 0.0 /100 | #286 | Tragic 96.2% |
| Immigrants | Trinidad and Tobago | 0.0 /100 | #287 | Tragic 96.2% |
| Malaysians | 0.0 /100 | #288 | Tragic 96.2% |
| Immigrants | Eritrea | 0.0 /100 | #289 | Tragic 96.1% |
| Immigrants | Somalia | 0.0 /100 | #290 | Tragic 96.1% |
| Immigrants | St. Vincent and the Grenadines | 0.0 /100 | #291 | Tragic 96.1% |
| Immigrants | Barbados | 0.0 /100 | #292 | Tragic 96.1% |
| Immigrants | West Indies | 0.0 /100 | #293 | Tragic 96.1% |
| British West Indians | 0.0 /100 | #294 | Tragic 96.0% |