Kenyan vs Immigrants from Trinidad and Tobago 6th Grade
COMPARE
Kenyan
Immigrants from Trinidad and Tobago
6th Grade
6th Grade Comparison
Kenyans
Immigrants from Trinidad and Tobago
97.1%
6TH GRADE
62.9/ 100
METRIC RATING
159th/ 347
METRIC RANK
96.2%
6TH GRADE
0.0/ 100
METRIC RATING
287th/ 347
METRIC RANK
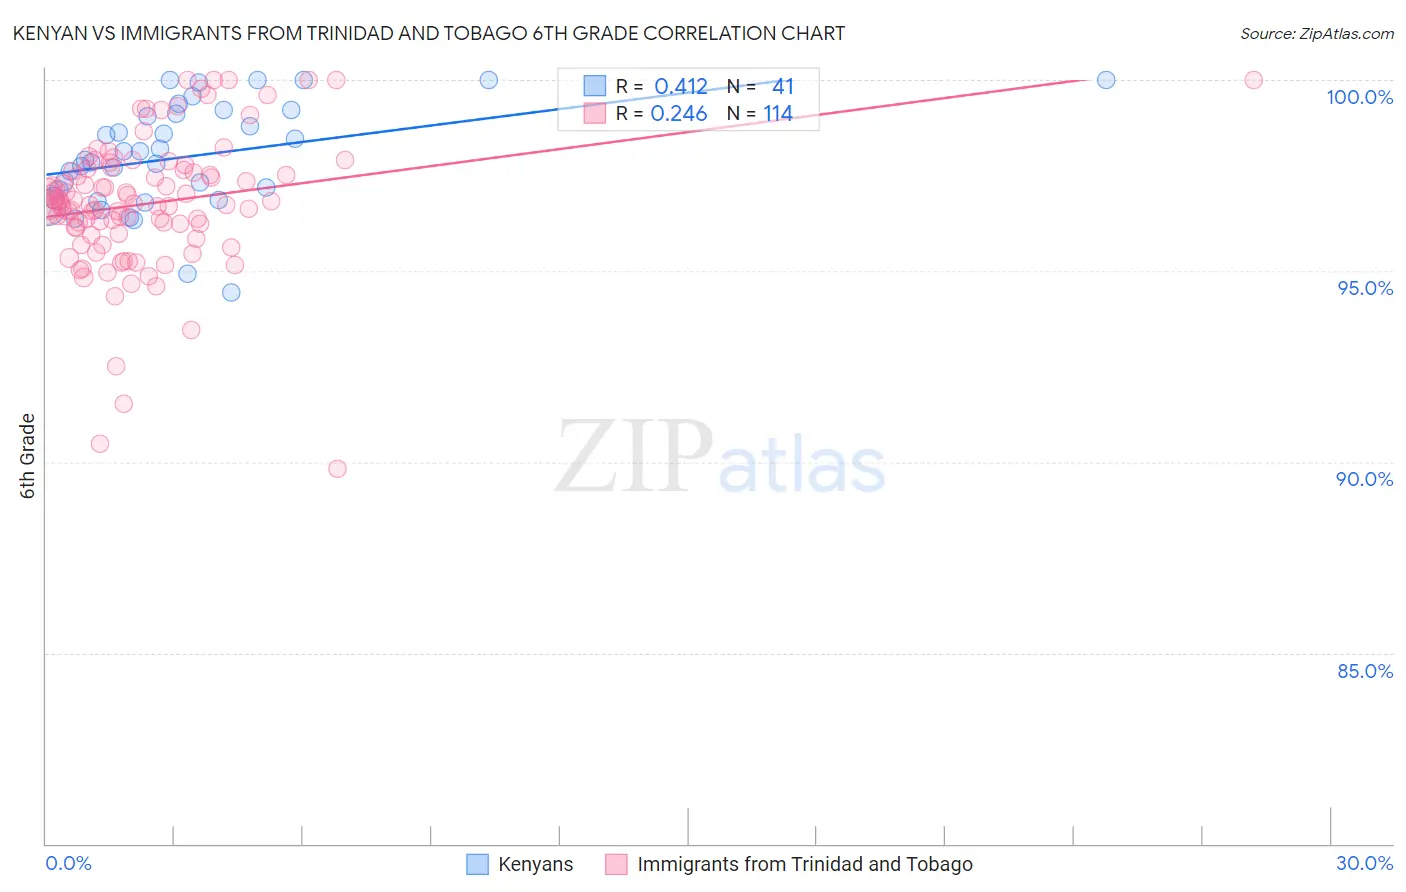
Kenyan vs Immigrants from Trinidad and Tobago 6th Grade Correlation Chart
The statistical analysis conducted on geographies consisting of 168,244,042 people shows a moderate positive correlation between the proportion of Kenyans and percentage of population with at least 6th grade education in the United States with a correlation coefficient (R) of 0.412 and weighted average of 97.1%. Similarly, the statistical analysis conducted on geographies consisting of 223,526,834 people shows a weak positive correlation between the proportion of Immigrants from Trinidad and Tobago and percentage of population with at least 6th grade education in the United States with a correlation coefficient (R) of 0.246 and weighted average of 96.2%, a difference of 0.97%.
6th Grade Correlation Summary
| Measurement | Kenyan | Immigrants from Trinidad and Tobago |
| Minimum | 94.4% | 89.8% |
| Maximum | 100.0% | 100.0% |
| Range | 5.6% | 10.2% |
| Mean | 98.0% | 96.8% |
| Median | 97.9% | 96.7% |
| Interquartile 25% (IQ1) | 96.9% | 96.1% |
| Interquartile 75% (IQ3) | 99.2% | 97.6% |
| Interquartile Range (IQR) | 2.3% | 1.5% |
| Standard Deviation (Sample) | 1.4% | 1.8% |
| Standard Deviation (Population) | 1.4% | 1.8% |
Similar Demographics by 6th Grade
Demographics Similar to Kenyans by 6th Grade
In terms of 6th grade, the demographic groups most similar to Kenyans are Immigrants from Iran (97.1%, a difference of 0.0%), Ugandan (97.1%, a difference of 0.0%), Immigrants from Belarus (97.1%, a difference of 0.010%), Marshallese (97.1%, a difference of 0.010%), and Immigrants from Russia (97.1%, a difference of 0.020%).
| Demographics | Rating | Rank | 6th Grade |
| Immigrants | Jordan | 73.0 /100 | #152 | Good 97.2% |
| Immigrants | Eastern Europe | 72.6 /100 | #153 | Good 97.2% |
| Soviet Union | 71.5 /100 | #154 | Good 97.2% |
| Ute | 71.1 /100 | #155 | Good 97.1% |
| Alsatians | 69.8 /100 | #156 | Good 97.1% |
| Immigrants | Russia | 67.6 /100 | #157 | Good 97.1% |
| Immigrants | Iran | 63.3 /100 | #158 | Good 97.1% |
| Kenyans | 62.9 /100 | #159 | Good 97.1% |
| Ugandans | 62.2 /100 | #160 | Good 97.1% |
| Immigrants | Belarus | 60.4 /100 | #161 | Good 97.1% |
| Marshallese | 60.2 /100 | #162 | Good 97.1% |
| Albanians | 57.8 /100 | #163 | Average 97.1% |
| Immigrants | Korea | 57.7 /100 | #164 | Average 97.1% |
| Immigrants | Poland | 56.2 /100 | #165 | Average 97.1% |
| Immigrants | Italy | 53.8 /100 | #166 | Average 97.1% |
Demographics Similar to Immigrants from Trinidad and Tobago by 6th Grade
In terms of 6th grade, the demographic groups most similar to Immigrants from Trinidad and Tobago are Barbadian (96.2%, a difference of 0.010%), Malaysian (96.2%, a difference of 0.010%), Immigrants from Eritrea (96.1%, a difference of 0.030%), Somali (96.2%, a difference of 0.040%), and Fijian (96.2%, a difference of 0.050%).
| Demographics | Rating | Rank | 6th Grade |
| Immigrants | Afghanistan | 0.1 /100 | #280 | Tragic 96.2% |
| Trinidadians and Tobagonians | 0.1 /100 | #281 | Tragic 96.2% |
| Houma | 0.1 /100 | #282 | Tragic 96.2% |
| Cubans | 0.1 /100 | #283 | Tragic 96.2% |
| Fijians | 0.1 /100 | #284 | Tragic 96.2% |
| Somalis | 0.1 /100 | #285 | Tragic 96.2% |
| Barbadians | 0.0 /100 | #286 | Tragic 96.2% |
| Immigrants | Trinidad and Tobago | 0.0 /100 | #287 | Tragic 96.2% |
| Malaysians | 0.0 /100 | #288 | Tragic 96.2% |
| Immigrants | Eritrea | 0.0 /100 | #289 | Tragic 96.1% |
| Immigrants | Somalia | 0.0 /100 | #290 | Tragic 96.1% |
| Immigrants | St. Vincent and the Grenadines | 0.0 /100 | #291 | Tragic 96.1% |
| Immigrants | Barbados | 0.0 /100 | #292 | Tragic 96.1% |
| Immigrants | West Indies | 0.0 /100 | #293 | Tragic 96.1% |
| British West Indians | 0.0 /100 | #294 | Tragic 96.0% |