Moroccan vs Immigrants from Liberia Master's Degree
COMPARE
Moroccan
Immigrants from Liberia
Master's Degree
Master's Degree Comparison
Moroccans
Immigrants from Liberia
16.8%
MASTER'S DEGREE
98.0/ 100
METRIC RATING
109th/ 347
METRIC RANK
12.5%
MASTER'S DEGREE
0.6/ 100
METRIC RATING
258th/ 347
METRIC RANK
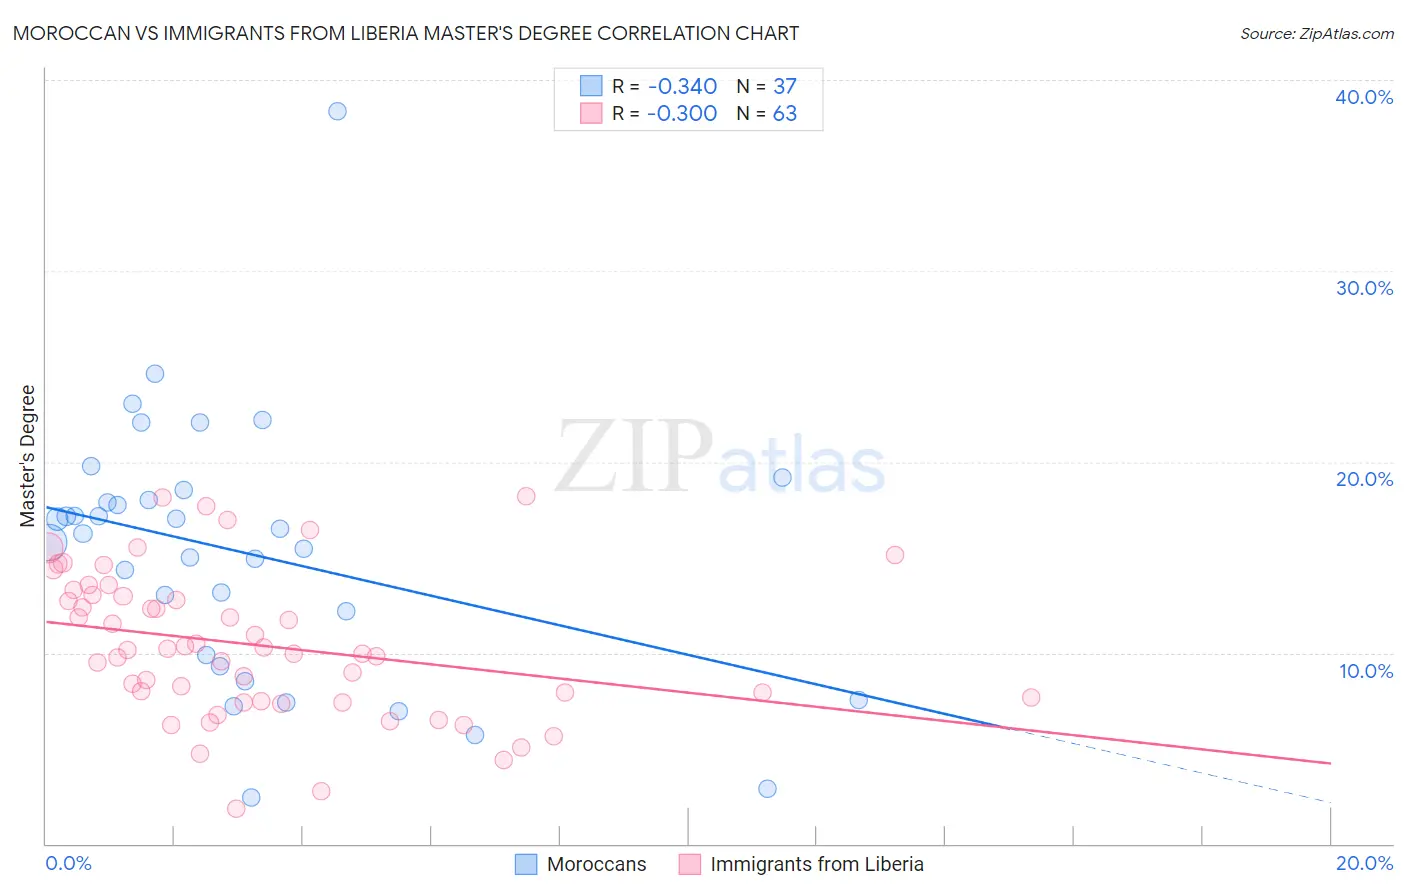
Moroccan vs Immigrants from Liberia Master's Degree Correlation Chart
The statistical analysis conducted on geographies consisting of 201,797,858 people shows a mild negative correlation between the proportion of Moroccans and percentage of population with at least master's degree education in the United States with a correlation coefficient (R) of -0.340 and weighted average of 16.8%. Similarly, the statistical analysis conducted on geographies consisting of 135,237,477 people shows a weak negative correlation between the proportion of Immigrants from Liberia and percentage of population with at least master's degree education in the United States with a correlation coefficient (R) of -0.300 and weighted average of 12.5%, a difference of 34.1%.
Master's Degree Correlation Summary
| Measurement | Moroccan | Immigrants from Liberia |
| Minimum | 2.4% | 1.9% |
| Maximum | 38.4% | 18.2% |
| Range | 36.0% | 16.4% |
| Mean | 15.2% | 10.4% |
| Median | 16.2% | 10.2% |
| Interquartile 25% (IQ1) | 9.6% | 7.5% |
| Interquartile 75% (IQ3) | 18.2% | 13.0% |
| Interquartile Range (IQR) | 8.7% | 5.6% |
| Standard Deviation (Sample) | 6.9% | 3.8% |
| Standard Deviation (Population) | 6.8% | 3.8% |
Similar Demographics by Master's Degree
Demographics Similar to Moroccans by Master's Degree
In terms of master's degree, the demographic groups most similar to Moroccans are Sierra Leonean (16.8%, a difference of 0.020%), Immigrants from Chile (16.8%, a difference of 0.030%), Armenian (16.8%, a difference of 0.050%), Immigrants from Albania (16.8%, a difference of 0.14%), and Austrian (16.7%, a difference of 0.30%).
| Demographics | Rating | Rank | Master's Degree |
| Chileans | 98.6 /100 | #102 | Exceptional 16.9% |
| Alsatians | 98.4 /100 | #103 | Exceptional 16.9% |
| Ukrainians | 98.3 /100 | #104 | Exceptional 16.9% |
| Syrians | 98.3 /100 | #105 | Exceptional 16.8% |
| Immigrants | Albania | 98.1 /100 | #106 | Exceptional 16.8% |
| Armenians | 98.0 /100 | #107 | Exceptional 16.8% |
| Sierra Leoneans | 98.0 /100 | #108 | Exceptional 16.8% |
| Moroccans | 98.0 /100 | #109 | Exceptional 16.8% |
| Immigrants | Chile | 98.0 /100 | #110 | Exceptional 16.8% |
| Austrians | 97.8 /100 | #111 | Exceptional 16.7% |
| Macedonians | 97.7 /100 | #112 | Exceptional 16.7% |
| Arabs | 97.7 /100 | #113 | Exceptional 16.7% |
| Northern Europeans | 97.6 /100 | #114 | Exceptional 16.7% |
| Immigrants | Uganda | 97.3 /100 | #115 | Exceptional 16.6% |
| Immigrants | Southern Europe | 97.2 /100 | #116 | Exceptional 16.6% |
Demographics Similar to Immigrants from Liberia by Master's Degree
In terms of master's degree, the demographic groups most similar to Immigrants from Liberia are Japanese (12.5%, a difference of 0.090%), Dominican (12.5%, a difference of 0.10%), Tongan (12.5%, a difference of 0.13%), Nicaraguan (12.5%, a difference of 0.32%), and Osage (12.6%, a difference of 0.50%).
| Demographics | Rating | Rank | Master's Degree |
| Tlingit-Haida | 1.3 /100 | #251 | Tragic 12.8% |
| French American Indians | 1.0 /100 | #252 | Tragic 12.7% |
| Immigrants | Dominica | 0.8 /100 | #253 | Tragic 12.6% |
| Indonesians | 0.8 /100 | #254 | Tragic 12.6% |
| Immigrants | Congo | 0.8 /100 | #255 | Tragic 12.6% |
| Immigrants | Portugal | 0.8 /100 | #256 | Tragic 12.6% |
| Osage | 0.7 /100 | #257 | Tragic 12.6% |
| Immigrants | Liberia | 0.6 /100 | #258 | Tragic 12.5% |
| Japanese | 0.6 /100 | #259 | Tragic 12.5% |
| Dominicans | 0.6 /100 | #260 | Tragic 12.5% |
| Tongans | 0.6 /100 | #261 | Tragic 12.5% |
| Nicaraguans | 0.6 /100 | #262 | Tragic 12.5% |
| Central American Indians | 0.5 /100 | #263 | Tragic 12.4% |
| Belizeans | 0.5 /100 | #264 | Tragic 12.4% |
| Immigrants | Fiji | 0.5 /100 | #265 | Tragic 12.4% |