Creek vs Immigrants from Liberia Master's Degree
COMPARE
Creek
Immigrants from Liberia
Master's Degree
Master's Degree Comparison
Creek
Immigrants from Liberia
10.5%
MASTER'S DEGREE
0.0/ 100
METRIC RATING
326th/ 347
METRIC RANK
12.5%
MASTER'S DEGREE
0.6/ 100
METRIC RATING
258th/ 347
METRIC RANK
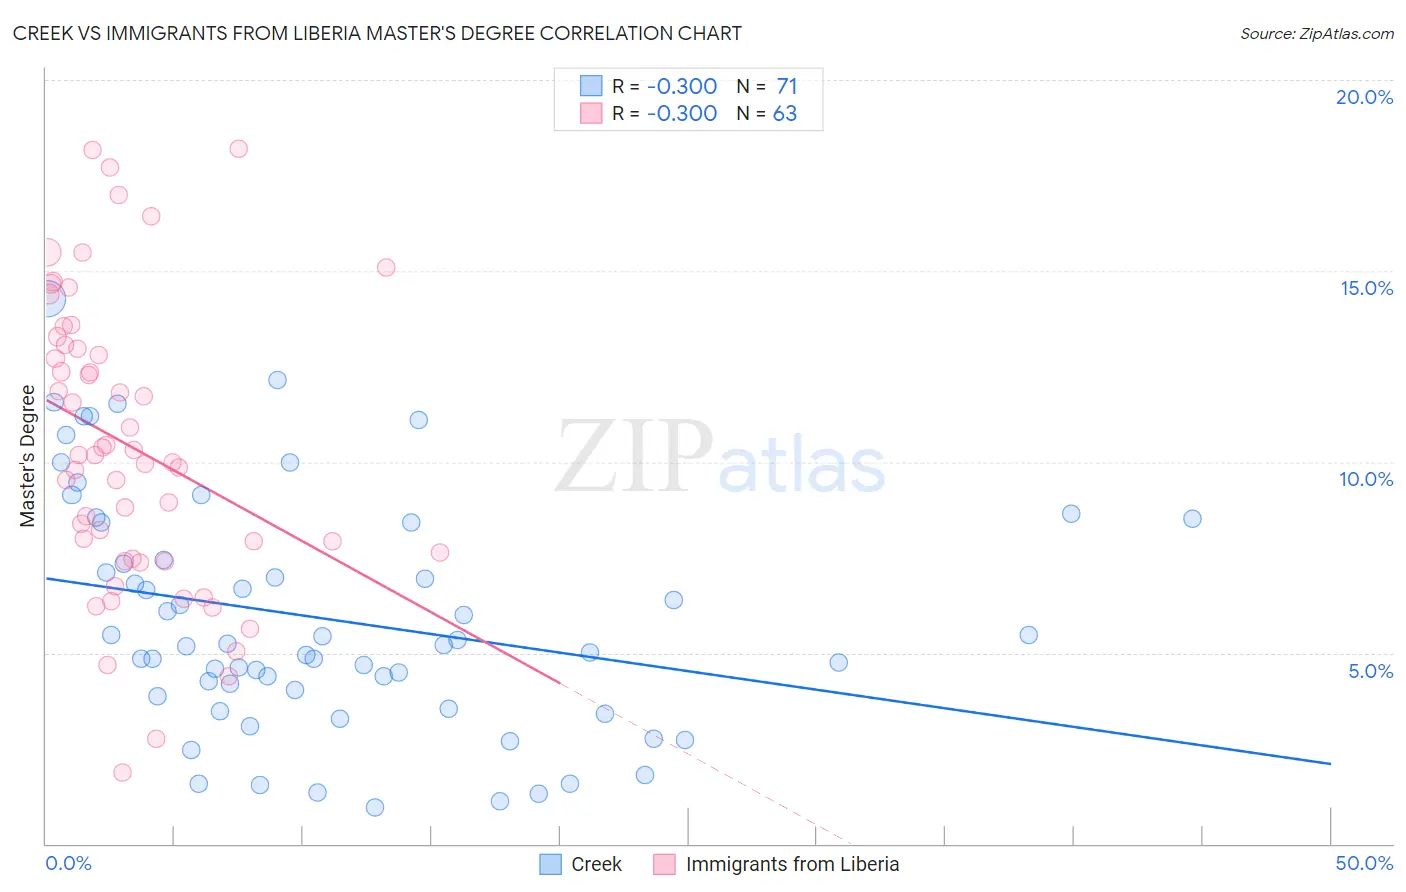
Creek vs Immigrants from Liberia Master's Degree Correlation Chart
The statistical analysis conducted on geographies consisting of 178,384,928 people shows a weak negative correlation between the proportion of Creek and percentage of population with at least master's degree education in the United States with a correlation coefficient (R) of -0.300 and weighted average of 10.5%. Similarly, the statistical analysis conducted on geographies consisting of 135,237,477 people shows a weak negative correlation between the proportion of Immigrants from Liberia and percentage of population with at least master's degree education in the United States with a correlation coefficient (R) of -0.300 and weighted average of 12.5%, a difference of 19.0%.
Master's Degree Correlation Summary
| Measurement | Creek | Immigrants from Liberia |
| Minimum | 0.96% | 1.9% |
| Maximum | 14.3% | 18.2% |
| Range | 13.3% | 16.4% |
| Mean | 5.9% | 10.4% |
| Median | 5.2% | 10.2% |
| Interquartile 25% (IQ1) | 3.9% | 7.5% |
| Interquartile 75% (IQ3) | 8.4% | 13.0% |
| Interquartile Range (IQR) | 4.5% | 5.6% |
| Standard Deviation (Sample) | 3.1% | 3.8% |
| Standard Deviation (Population) | 3.1% | 3.8% |
Similar Demographics by Master's Degree
Demographics Similar to Creek by Master's Degree
In terms of master's degree, the demographic groups most similar to Creek are Inupiat (10.5%, a difference of 0.0%), Paiute (10.5%, a difference of 0.18%), Bangladeshi (10.5%, a difference of 0.32%), Nepalese (10.5%, a difference of 0.40%), and Dutch West Indian (10.6%, a difference of 1.1%).
| Demographics | Rating | Rank | Master's Degree |
| Kiowa | 0.0 /100 | #319 | Tragic 10.8% |
| Immigrants | Micronesia | 0.0 /100 | #320 | Tragic 10.8% |
| Pennsylvania Germans | 0.0 /100 | #321 | Tragic 10.7% |
| Sioux | 0.0 /100 | #322 | Tragic 10.7% |
| Crow | 0.0 /100 | #323 | Tragic 10.6% |
| Dutch West Indians | 0.0 /100 | #324 | Tragic 10.6% |
| Inupiat | 0.0 /100 | #325 | Tragic 10.5% |
| Creek | 0.0 /100 | #326 | Tragic 10.5% |
| Paiute | 0.0 /100 | #327 | Tragic 10.5% |
| Bangladeshis | 0.0 /100 | #328 | Tragic 10.5% |
| Nepalese | 0.0 /100 | #329 | Tragic 10.5% |
| Fijians | 0.0 /100 | #330 | Tragic 10.3% |
| Pueblo | 0.0 /100 | #331 | Tragic 10.3% |
| Immigrants | Azores | 0.0 /100 | #332 | Tragic 10.2% |
| Menominee | 0.0 /100 | #333 | Tragic 10.2% |
Demographics Similar to Immigrants from Liberia by Master's Degree
In terms of master's degree, the demographic groups most similar to Immigrants from Liberia are Japanese (12.5%, a difference of 0.090%), Dominican (12.5%, a difference of 0.10%), Tongan (12.5%, a difference of 0.13%), Nicaraguan (12.5%, a difference of 0.32%), and Osage (12.6%, a difference of 0.50%).
| Demographics | Rating | Rank | Master's Degree |
| Tlingit-Haida | 1.3 /100 | #251 | Tragic 12.8% |
| French American Indians | 1.0 /100 | #252 | Tragic 12.7% |
| Immigrants | Dominica | 0.8 /100 | #253 | Tragic 12.6% |
| Indonesians | 0.8 /100 | #254 | Tragic 12.6% |
| Immigrants | Congo | 0.8 /100 | #255 | Tragic 12.6% |
| Immigrants | Portugal | 0.8 /100 | #256 | Tragic 12.6% |
| Osage | 0.7 /100 | #257 | Tragic 12.6% |
| Immigrants | Liberia | 0.6 /100 | #258 | Tragic 12.5% |
| Japanese | 0.6 /100 | #259 | Tragic 12.5% |
| Dominicans | 0.6 /100 | #260 | Tragic 12.5% |
| Tongans | 0.6 /100 | #261 | Tragic 12.5% |
| Nicaraguans | 0.6 /100 | #262 | Tragic 12.5% |
| Central American Indians | 0.5 /100 | #263 | Tragic 12.4% |
| Belizeans | 0.5 /100 | #264 | Tragic 12.4% |
| Immigrants | Fiji | 0.5 /100 | #265 | Tragic 12.4% |