Subsaharan African vs Maltese Master's Degree
COMPARE
Subsaharan African
Maltese
Master's Degree
Master's Degree Comparison
Sub-Saharan Africans
Maltese
14.2%
MASTER'S DEGREE
19.4/ 100
METRIC RATING
210th/ 347
METRIC RANK
17.3%
MASTER'S DEGREE
99.3/ 100
METRIC RATING
87th/ 347
METRIC RANK
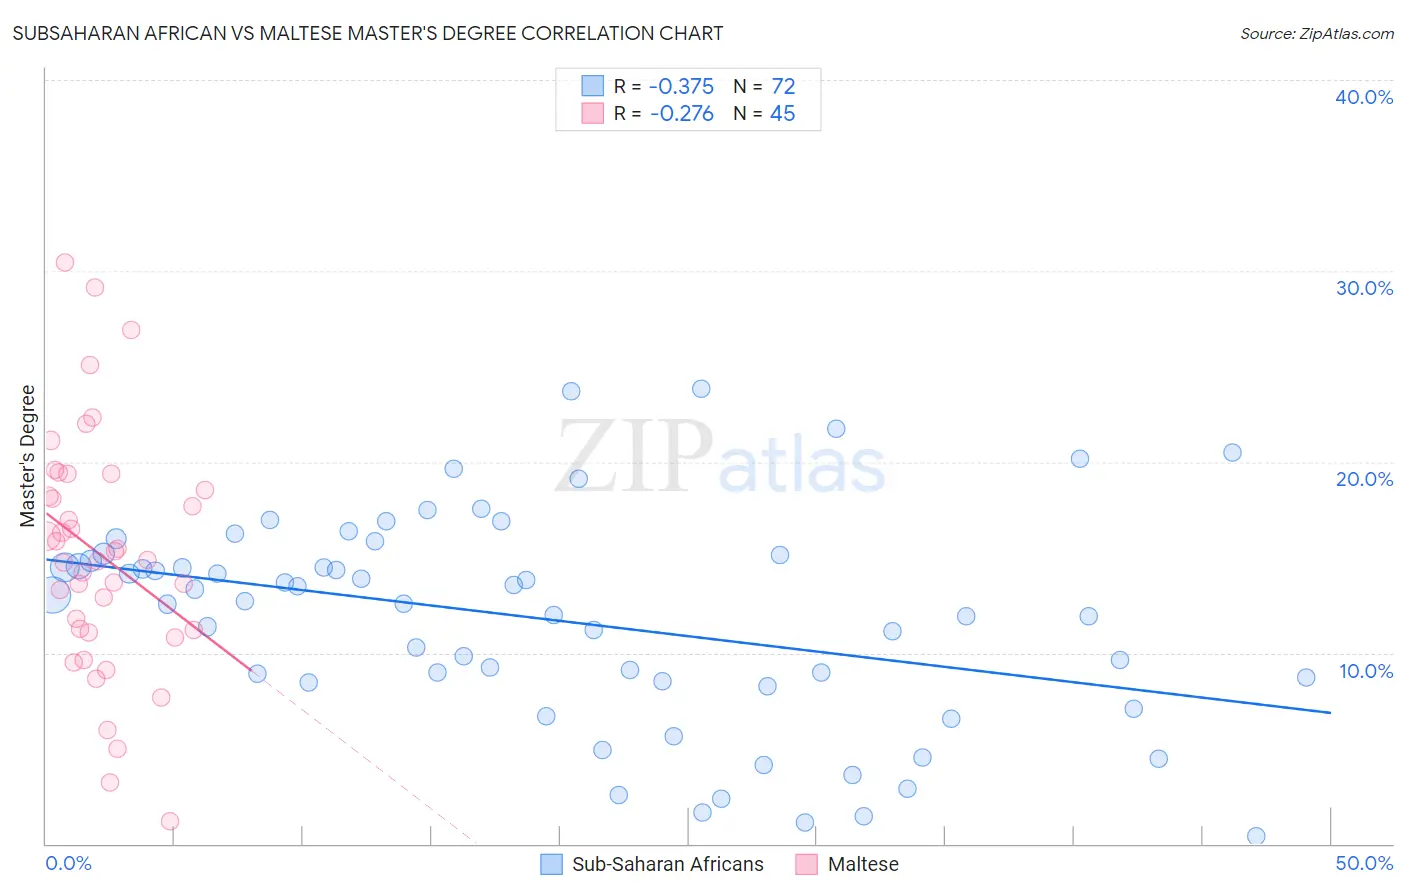
Subsaharan African vs Maltese Master's Degree Correlation Chart
The statistical analysis conducted on geographies consisting of 507,799,388 people shows a mild negative correlation between the proportion of Sub-Saharan Africans and percentage of population with at least master's degree education in the United States with a correlation coefficient (R) of -0.375 and weighted average of 14.2%. Similarly, the statistical analysis conducted on geographies consisting of 126,460,442 people shows a weak negative correlation between the proportion of Maltese and percentage of population with at least master's degree education in the United States with a correlation coefficient (R) of -0.276 and weighted average of 17.3%, a difference of 21.2%.
Master's Degree Correlation Summary
| Measurement | Subsaharan African | Maltese |
| Minimum | 0.40% | 1.2% |
| Maximum | 23.9% | 30.4% |
| Range | 23.5% | 29.2% |
| Mean | 11.7% | 15.1% |
| Median | 12.6% | 14.8% |
| Interquartile 25% (IQ1) | 8.5% | 11.1% |
| Interquartile 75% (IQ3) | 15.0% | 18.9% |
| Interquartile Range (IQR) | 6.5% | 7.8% |
| Standard Deviation (Sample) | 5.5% | 6.3% |
| Standard Deviation (Population) | 5.5% | 6.2% |
Similar Demographics by Master's Degree
Demographics Similar to Sub-Saharan Africans by Master's Degree
In terms of master's degree, the demographic groups most similar to Sub-Saharan Africans are Immigrants from Panama (14.3%, a difference of 0.13%), Immigrants from Barbados (14.3%, a difference of 0.22%), Somali (14.2%, a difference of 0.31%), Spanish (14.2%, a difference of 0.36%), and Immigrants from Bosnia and Herzegovina (14.3%, a difference of 0.52%).
| Demographics | Rating | Rank | Master's Degree |
| Yugoslavians | 24.3 /100 | #203 | Fair 14.4% |
| French | 23.7 /100 | #204 | Fair 14.4% |
| Trinidadians and Tobagonians | 23.5 /100 | #205 | Fair 14.4% |
| Scandinavians | 23.3 /100 | #206 | Fair 14.4% |
| Immigrants | Bosnia and Herzegovina | 22.0 /100 | #207 | Fair 14.3% |
| Immigrants | Barbados | 20.5 /100 | #208 | Fair 14.3% |
| Immigrants | Panama | 20.0 /100 | #209 | Fair 14.3% |
| Sub-Saharan Africans | 19.4 /100 | #210 | Poor 14.2% |
| Somalis | 18.0 /100 | #211 | Poor 14.2% |
| Spanish | 17.8 /100 | #212 | Poor 14.2% |
| Immigrants | Thailand | 17.0 /100 | #213 | Poor 14.2% |
| Finns | 16.9 /100 | #214 | Poor 14.2% |
| Immigrants | Vietnam | 16.1 /100 | #215 | Poor 14.1% |
| Immigrants | Somalia | 15.8 /100 | #216 | Poor 14.1% |
| Immigrants | Trinidad and Tobago | 15.8 /100 | #217 | Poor 14.1% |
Demographics Similar to Maltese by Master's Degree
In terms of master's degree, the demographic groups most similar to Maltese are Immigrants from Croatia (17.3%, a difference of 0.10%), Immigrants from Canada (17.2%, a difference of 0.36%), Bhutanese (17.2%, a difference of 0.43%), Immigrants from Egypt (17.2%, a difference of 0.45%), and Immigrants from Brazil (17.4%, a difference of 0.51%).
| Demographics | Rating | Rank | Master's Degree |
| Carpatho Rusyns | 99.6 /100 | #80 | Exceptional 17.5% |
| Immigrants | Western Asia | 99.5 /100 | #81 | Exceptional 17.5% |
| Greeks | 99.5 /100 | #82 | Exceptional 17.5% |
| Immigrants | Zimbabwe | 99.5 /100 | #83 | Exceptional 17.4% |
| Immigrants | Scotland | 99.4 /100 | #84 | Exceptional 17.4% |
| Immigrants | Brazil | 99.4 /100 | #85 | Exceptional 17.4% |
| Immigrants | Croatia | 99.3 /100 | #86 | Exceptional 17.3% |
| Maltese | 99.3 /100 | #87 | Exceptional 17.3% |
| Immigrants | Canada | 99.2 /100 | #88 | Exceptional 17.2% |
| Bhutanese | 99.1 /100 | #89 | Exceptional 17.2% |
| Immigrants | Egypt | 99.1 /100 | #90 | Exceptional 17.2% |
| Romanians | 99.1 /100 | #91 | Exceptional 17.2% |
| Immigrants | North America | 99.1 /100 | #92 | Exceptional 17.2% |
| Immigrants | Italy | 99.1 /100 | #93 | Exceptional 17.2% |
| Ugandans | 99.0 /100 | #94 | Exceptional 17.1% |