Sri Lankan vs Choctaw Associate's Degree
COMPARE
Sri Lankan
Choctaw
Associate's Degree
Associate's Degree Comparison
Sri Lankans
Choctaw
46.3%
ASSOCIATE'S DEGREE
47.6/ 100
METRIC RATING
179th/ 347
METRIC RANK
37.8%
ASSOCIATE'S DEGREE
0.0/ 100
METRIC RATING
312th/ 347
METRIC RANK
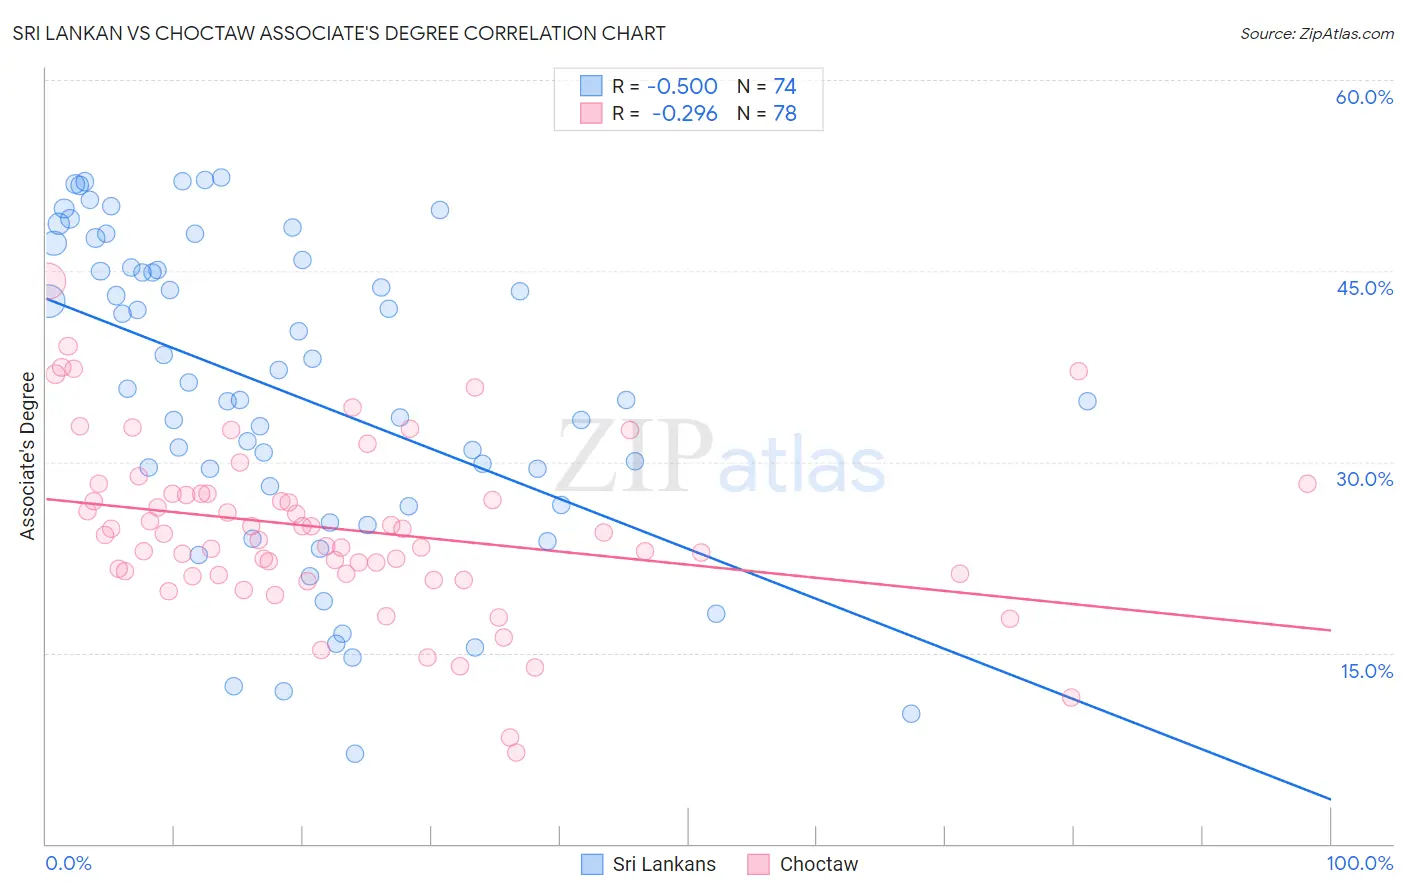
Sri Lankan vs Choctaw Associate's Degree Correlation Chart
The statistical analysis conducted on geographies consisting of 440,543,286 people shows a substantial negative correlation between the proportion of Sri Lankans and percentage of population with at least associate's degree education in the United States with a correlation coefficient (R) of -0.500 and weighted average of 46.3%. Similarly, the statistical analysis conducted on geographies consisting of 269,730,992 people shows a weak negative correlation between the proportion of Choctaw and percentage of population with at least associate's degree education in the United States with a correlation coefficient (R) of -0.296 and weighted average of 37.8%, a difference of 22.5%.
Associate's Degree Correlation Summary
| Measurement | Sri Lankan | Choctaw |
| Minimum | 7.0% | 7.1% |
| Maximum | 52.3% | 44.2% |
| Range | 45.3% | 37.1% |
| Mean | 35.4% | 24.7% |
| Median | 35.3% | 24.3% |
| Interquartile 25% (IQ1) | 26.6% | 21.2% |
| Interquartile 75% (IQ3) | 45.3% | 27.5% |
| Interquartile Range (IQR) | 18.7% | 6.3% |
| Standard Deviation (Sample) | 12.2% | 6.8% |
| Standard Deviation (Population) | 12.1% | 6.8% |
Similar Demographics by Associate's Degree
Demographics Similar to Sri Lankans by Associate's Degree
In terms of associate's degree, the demographic groups most similar to Sri Lankans are Immigrants from Bosnia and Herzegovina (46.3%, a difference of 0.050%), Slovak (46.3%, a difference of 0.060%), Finnish (46.3%, a difference of 0.070%), Bermudan (46.2%, a difference of 0.090%), and Belgian (46.3%, a difference of 0.10%).
| Demographics | Rating | Rank | Associate's Degree |
| Peruvians | 50.5 /100 | #172 | Average 46.4% |
| Immigrants | Iraq | 50.3 /100 | #173 | Average 46.4% |
| English | 50.0 /100 | #174 | Average 46.4% |
| Belgians | 48.9 /100 | #175 | Average 46.3% |
| Finns | 48.5 /100 | #176 | Average 46.3% |
| Slovaks | 48.4 /100 | #177 | Average 46.3% |
| Immigrants | Bosnia and Herzegovina | 48.3 /100 | #178 | Average 46.3% |
| Sri Lankans | 47.6 /100 | #179 | Average 46.3% |
| Bermudans | 46.4 /100 | #180 | Average 46.2% |
| Immigrants | Colombia | 41.3 /100 | #181 | Average 46.0% |
| Swiss | 40.4 /100 | #182 | Average 46.0% |
| Yugoslavians | 40.2 /100 | #183 | Average 46.0% |
| Czechoslovakians | 40.0 /100 | #184 | Average 46.0% |
| Costa Ricans | 38.6 /100 | #185 | Fair 46.0% |
| Welsh | 37.9 /100 | #186 | Fair 45.9% |
Demographics Similar to Choctaw by Associate's Degree
In terms of associate's degree, the demographic groups most similar to Choctaw are Hispanic or Latino (37.7%, a difference of 0.15%), Seminole (37.7%, a difference of 0.20%), Immigrants from Latin America (37.9%, a difference of 0.22%), Immigrants from Dominican Republic (37.9%, a difference of 0.33%), and Creek (37.6%, a difference of 0.59%).
| Demographics | Rating | Rank | Associate's Degree |
| Immigrants | Honduras | 0.0 /100 | #305 | Tragic 38.5% |
| Shoshone | 0.0 /100 | #306 | Tragic 38.4% |
| Immigrants | El Salvador | 0.0 /100 | #307 | Tragic 38.4% |
| Mexican American Indians | 0.0 /100 | #308 | Tragic 38.2% |
| Immigrants | Guatemala | 0.0 /100 | #309 | Tragic 38.1% |
| Immigrants | Dominican Republic | 0.0 /100 | #310 | Tragic 37.9% |
| Immigrants | Latin America | 0.0 /100 | #311 | Tragic 37.9% |
| Choctaw | 0.0 /100 | #312 | Tragic 37.8% |
| Hispanics or Latinos | 0.0 /100 | #313 | Tragic 37.7% |
| Seminole | 0.0 /100 | #314 | Tragic 37.7% |
| Creek | 0.0 /100 | #315 | Tragic 37.6% |
| Crow | 0.0 /100 | #316 | Tragic 37.6% |
| Yaqui | 0.0 /100 | #317 | Tragic 37.6% |
| Alaska Natives | 0.0 /100 | #318 | Tragic 37.5% |
| Fijians | 0.0 /100 | #319 | Tragic 37.4% |