Sri Lankan vs Alsatian Associate's Degree
COMPARE
Sri Lankan
Alsatian
Associate's Degree
Associate's Degree Comparison
Sri Lankans
Alsatians
46.3%
ASSOCIATE'S DEGREE
47.6/ 100
METRIC RATING
179th/ 347
METRIC RANK
48.8%
ASSOCIATE'S DEGREE
94.6/ 100
METRIC RATING
120th/ 347
METRIC RANK
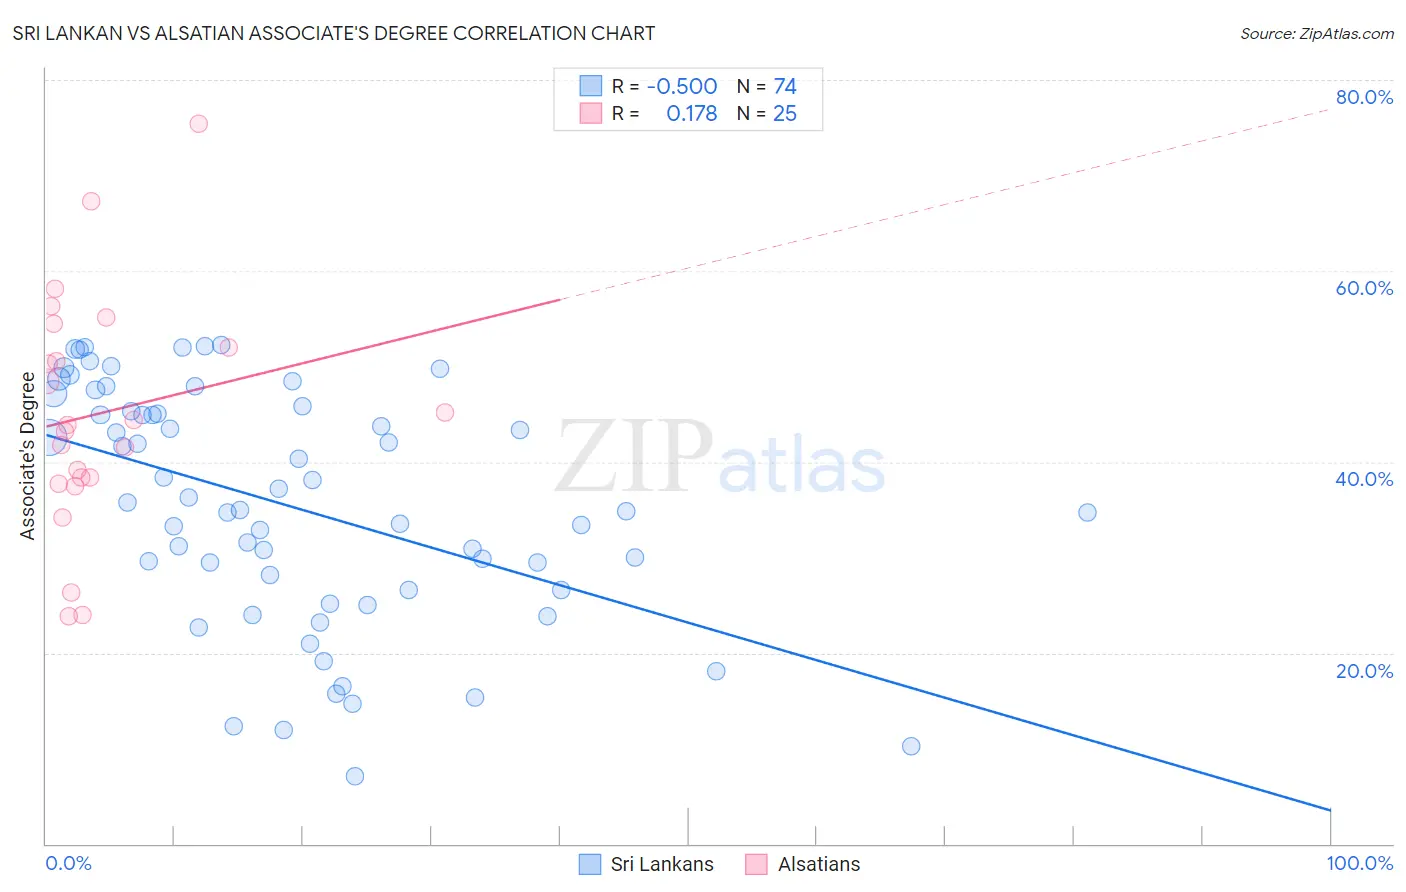
Sri Lankan vs Alsatian Associate's Degree Correlation Chart
The statistical analysis conducted on geographies consisting of 440,543,286 people shows a substantial negative correlation between the proportion of Sri Lankans and percentage of population with at least associate's degree education in the United States with a correlation coefficient (R) of -0.500 and weighted average of 46.3%. Similarly, the statistical analysis conducted on geographies consisting of 82,682,365 people shows a poor positive correlation between the proportion of Alsatians and percentage of population with at least associate's degree education in the United States with a correlation coefficient (R) of 0.178 and weighted average of 48.8%, a difference of 5.5%.
Associate's Degree Correlation Summary
| Measurement | Sri Lankan | Alsatian |
| Minimum | 7.0% | 23.9% |
| Maximum | 52.3% | 75.4% |
| Range | 45.3% | 51.6% |
| Mean | 35.4% | 45.1% |
| Median | 35.3% | 43.9% |
| Interquartile 25% (IQ1) | 26.6% | 38.0% |
| Interquartile 75% (IQ3) | 45.3% | 53.2% |
| Interquartile Range (IQR) | 18.7% | 15.2% |
| Standard Deviation (Sample) | 12.2% | 12.3% |
| Standard Deviation (Population) | 12.1% | 12.1% |
Similar Demographics by Associate's Degree
Demographics Similar to Sri Lankans by Associate's Degree
In terms of associate's degree, the demographic groups most similar to Sri Lankans are Immigrants from Bosnia and Herzegovina (46.3%, a difference of 0.050%), Slovak (46.3%, a difference of 0.060%), Finnish (46.3%, a difference of 0.070%), Bermudan (46.2%, a difference of 0.090%), and Belgian (46.3%, a difference of 0.10%).
| Demographics | Rating | Rank | Associate's Degree |
| Peruvians | 50.5 /100 | #172 | Average 46.4% |
| Immigrants | Iraq | 50.3 /100 | #173 | Average 46.4% |
| English | 50.0 /100 | #174 | Average 46.4% |
| Belgians | 48.9 /100 | #175 | Average 46.3% |
| Finns | 48.5 /100 | #176 | Average 46.3% |
| Slovaks | 48.4 /100 | #177 | Average 46.3% |
| Immigrants | Bosnia and Herzegovina | 48.3 /100 | #178 | Average 46.3% |
| Sri Lankans | 47.6 /100 | #179 | Average 46.3% |
| Bermudans | 46.4 /100 | #180 | Average 46.2% |
| Immigrants | Colombia | 41.3 /100 | #181 | Average 46.0% |
| Swiss | 40.4 /100 | #182 | Average 46.0% |
| Yugoslavians | 40.2 /100 | #183 | Average 46.0% |
| Czechoslovakians | 40.0 /100 | #184 | Average 46.0% |
| Costa Ricans | 38.6 /100 | #185 | Fair 46.0% |
| Welsh | 37.9 /100 | #186 | Fair 45.9% |
Demographics Similar to Alsatians by Associate's Degree
In terms of associate's degree, the demographic groups most similar to Alsatians are Lebanese (48.8%, a difference of 0.020%), Albanian (48.8%, a difference of 0.030%), Afghan (48.9%, a difference of 0.10%), British (48.9%, a difference of 0.14%), and Luxembourger (48.9%, a difference of 0.20%).
| Demographics | Rating | Rank | Associate's Degree |
| Palestinians | 95.3 /100 | #113 | Exceptional 49.0% |
| Arabs | 95.3 /100 | #114 | Exceptional 49.0% |
| Luxembourgers | 95.1 /100 | #115 | Exceptional 48.9% |
| British | 95.0 /100 | #116 | Exceptional 48.9% |
| Afghans | 94.8 /100 | #117 | Exceptional 48.9% |
| Albanians | 94.7 /100 | #118 | Exceptional 48.8% |
| Lebanese | 94.6 /100 | #119 | Exceptional 48.8% |
| Alsatians | 94.6 /100 | #120 | Exceptional 48.8% |
| Ugandans | 93.9 /100 | #121 | Exceptional 48.7% |
| Italians | 93.9 /100 | #122 | Exceptional 48.7% |
| Brazilians | 93.7 /100 | #123 | Exceptional 48.7% |
| Serbians | 92.6 /100 | #124 | Exceptional 48.5% |
| Chinese | 92.5 /100 | #125 | Exceptional 48.5% |
| Immigrants | Syria | 92.2 /100 | #126 | Exceptional 48.5% |
| Immigrants | Uganda | 92.1 /100 | #127 | Exceptional 48.5% |