Indian (Asian) vs Immigrants from Ecuador 10th Grade
COMPARE
Indian (Asian)
Immigrants from Ecuador
10th Grade
10th Grade Comparison
Indians (Asian)
Immigrants from Ecuador
93.4%
10TH GRADE
17.6/ 100
METRIC RATING
210th/ 347
METRIC RANK
90.4%
10TH GRADE
0.0/ 100
METRIC RATING
317th/ 347
METRIC RANK
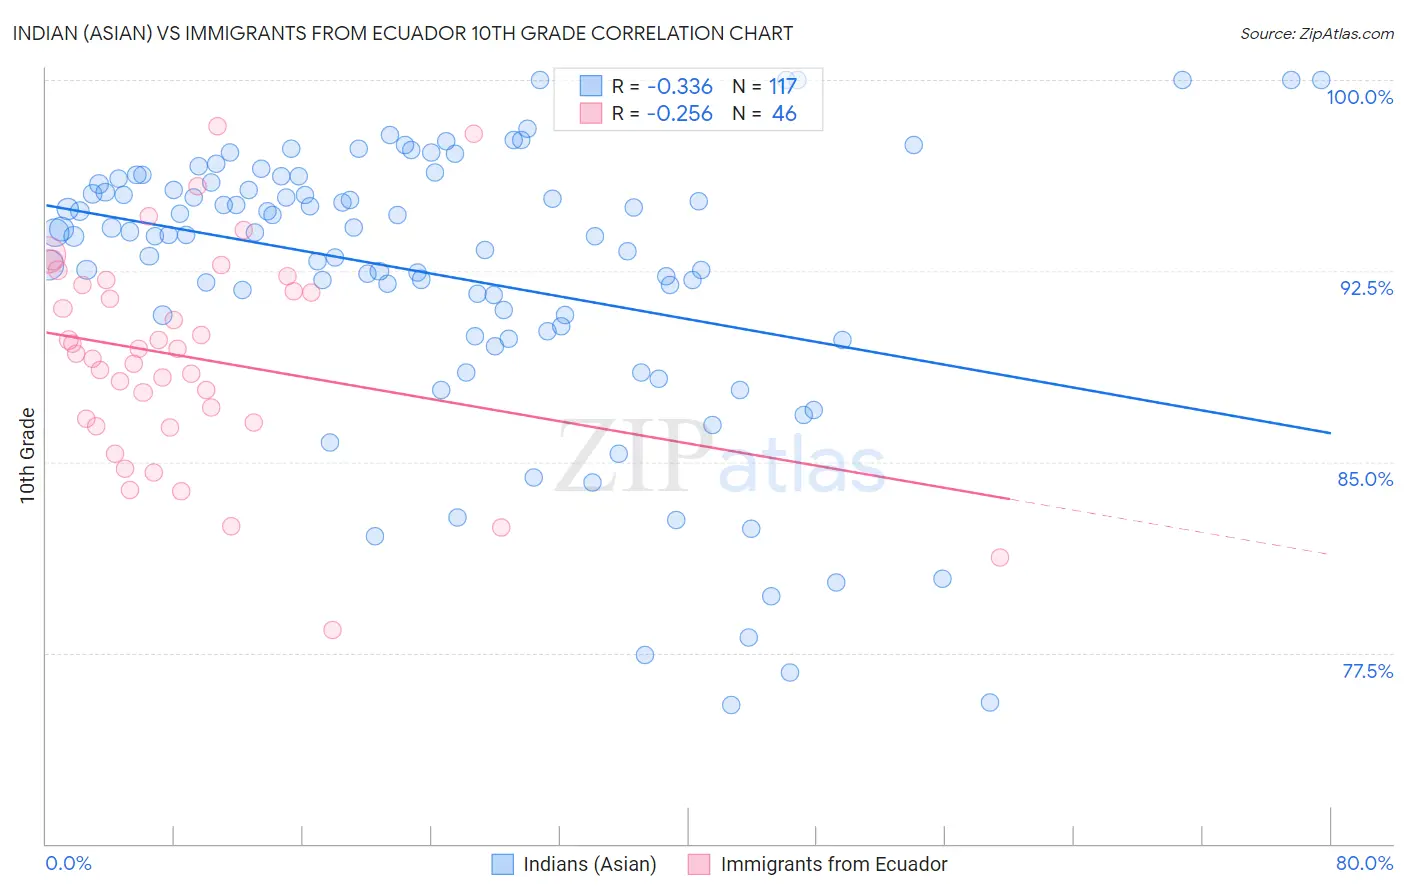
Indian (Asian) vs Immigrants from Ecuador 10th Grade Correlation Chart
The statistical analysis conducted on geographies consisting of 495,348,182 people shows a mild negative correlation between the proportion of Indians (Asian) and percentage of population with at least 10th grade education in the United States with a correlation coefficient (R) of -0.336 and weighted average of 93.4%. Similarly, the statistical analysis conducted on geographies consisting of 270,907,929 people shows a weak negative correlation between the proportion of Immigrants from Ecuador and percentage of population with at least 10th grade education in the United States with a correlation coefficient (R) of -0.256 and weighted average of 90.4%, a difference of 3.3%.
10th Grade Correlation Summary
| Measurement | Indian (Asian) | Immigrants from Ecuador |
| Minimum | 75.5% | 78.4% |
| Maximum | 100.0% | 98.2% |
| Range | 24.5% | 19.8% |
| Mean | 92.3% | 89.1% |
| Median | 93.9% | 89.3% |
| Interquartile 25% (IQ1) | 90.2% | 86.5% |
| Interquartile 75% (IQ3) | 95.9% | 91.9% |
| Interquartile Range (IQR) | 5.7% | 5.4% |
| Standard Deviation (Sample) | 5.6% | 4.2% |
| Standard Deviation (Population) | 5.5% | 4.1% |
Similar Demographics by 10th Grade
Demographics Similar to Indians (Asian) by 10th Grade
In terms of 10th grade, the demographic groups most similar to Indians (Asian) are Cajun (93.4%, a difference of 0.010%), Immigrants from Zaire (93.4%, a difference of 0.010%), Immigrants from Chile (93.4%, a difference of 0.020%), Samoan (93.4%, a difference of 0.030%), and Immigrants from Syria (93.4%, a difference of 0.030%).
| Demographics | Rating | Rank | 10th Grade |
| Immigrants | Western Asia | 20.6 /100 | #203 | Fair 93.4% |
| Ute | 20.3 /100 | #204 | Fair 93.4% |
| Immigrants | Indonesia | 20.2 /100 | #205 | Fair 93.4% |
| Immigrants | Sudan | 20.0 /100 | #206 | Fair 93.4% |
| Samoans | 19.5 /100 | #207 | Poor 93.4% |
| Immigrants | Syria | 19.4 /100 | #208 | Poor 93.4% |
| Immigrants | Chile | 18.8 /100 | #209 | Poor 93.4% |
| Indians (Asian) | 17.6 /100 | #210 | Poor 93.4% |
| Cajuns | 16.9 /100 | #211 | Poor 93.4% |
| Immigrants | Zaire | 16.7 /100 | #212 | Poor 93.4% |
| Immigrants | Asia | 15.7 /100 | #213 | Poor 93.4% |
| Immigrants | Bahamas | 15.2 /100 | #214 | Poor 93.4% |
| Immigrants | Oceania | 15.1 /100 | #215 | Poor 93.4% |
| Immigrants | Eastern Africa | 14.7 /100 | #216 | Poor 93.4% |
| Portuguese | 12.1 /100 | #217 | Poor 93.3% |
Demographics Similar to Immigrants from Ecuador by 10th Grade
In terms of 10th grade, the demographic groups most similar to Immigrants from Ecuador are Ecuadorian (90.6%, a difference of 0.17%), Immigrants from Caribbean (90.6%, a difference of 0.18%), Immigrants from Cuba (90.2%, a difference of 0.23%), Nepalese (90.7%, a difference of 0.26%), and Nicaraguan (90.2%, a difference of 0.31%).
| Demographics | Rating | Rank | 10th Grade |
| Vietnamese | 0.0 /100 | #310 | Tragic 90.9% |
| Immigrants | Cambodia | 0.0 /100 | #311 | Tragic 90.9% |
| Immigrants | Portugal | 0.0 /100 | #312 | Tragic 90.8% |
| Cape Verdeans | 0.0 /100 | #313 | Tragic 90.8% |
| Nepalese | 0.0 /100 | #314 | Tragic 90.7% |
| Immigrants | Caribbean | 0.0 /100 | #315 | Tragic 90.6% |
| Ecuadorians | 0.0 /100 | #316 | Tragic 90.6% |
| Immigrants | Ecuador | 0.0 /100 | #317 | Tragic 90.4% |
| Immigrants | Cuba | 0.0 /100 | #318 | Tragic 90.2% |
| Nicaraguans | 0.0 /100 | #319 | Tragic 90.2% |
| Houma | 0.0 /100 | #320 | Tragic 90.2% |
| Belizeans | 0.0 /100 | #321 | Tragic 90.2% |
| Tohono O'odham | 0.0 /100 | #322 | Tragic 90.1% |
| Immigrants | Belize | 0.0 /100 | #323 | Tragic 90.1% |
| Immigrants | Armenia | 0.0 /100 | #324 | Tragic 89.9% |