Chinese vs Immigrants from Ecuador 10th Grade
COMPARE
Chinese
Immigrants from Ecuador
10th Grade
10th Grade Comparison
Chinese
Immigrants from Ecuador
95.5%
10TH GRADE
100.0/ 100
METRIC RATING
20th/ 347
METRIC RANK
90.4%
10TH GRADE
0.0/ 100
METRIC RATING
317th/ 347
METRIC RANK
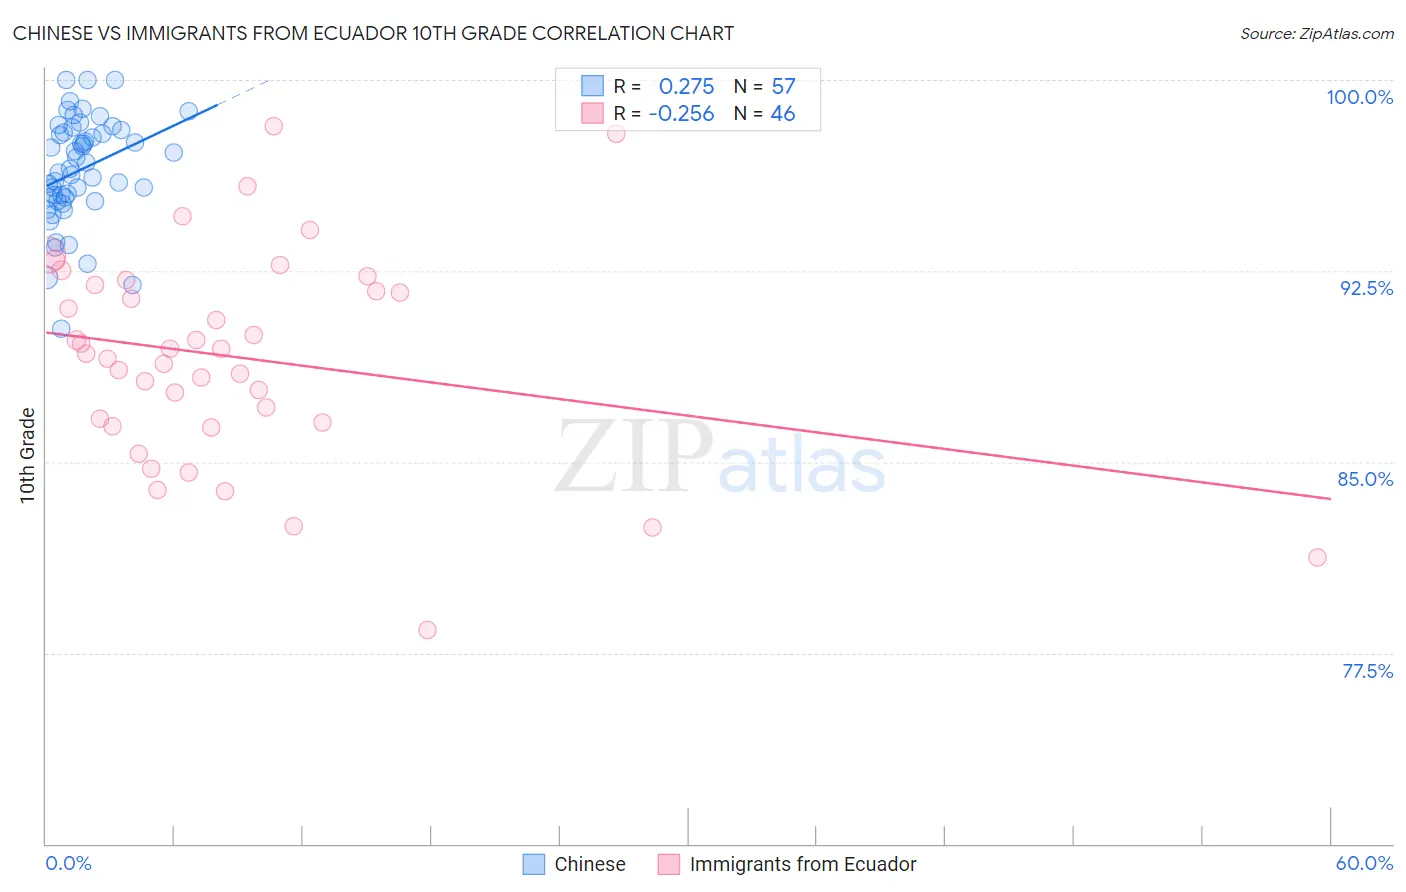
Chinese vs Immigrants from Ecuador 10th Grade Correlation Chart
The statistical analysis conducted on geographies consisting of 64,808,150 people shows a weak positive correlation between the proportion of Chinese and percentage of population with at least 10th grade education in the United States with a correlation coefficient (R) of 0.275 and weighted average of 95.5%. Similarly, the statistical analysis conducted on geographies consisting of 270,907,929 people shows a weak negative correlation between the proportion of Immigrants from Ecuador and percentage of population with at least 10th grade education in the United States with a correlation coefficient (R) of -0.256 and weighted average of 90.4%, a difference of 5.6%.
10th Grade Correlation Summary
| Measurement | Chinese | Immigrants from Ecuador |
| Minimum | 90.2% | 78.4% |
| Maximum | 100.0% | 98.2% |
| Range | 9.8% | 19.8% |
| Mean | 96.5% | 89.1% |
| Median | 96.5% | 89.3% |
| Interquartile 25% (IQ1) | 95.3% | 86.5% |
| Interquartile 75% (IQ3) | 98.0% | 91.9% |
| Interquartile Range (IQR) | 2.7% | 5.4% |
| Standard Deviation (Sample) | 2.1% | 4.2% |
| Standard Deviation (Population) | 2.1% | 4.1% |
Similar Demographics by 10th Grade
Demographics Similar to Chinese by 10th Grade
In terms of 10th grade, the demographic groups most similar to Chinese are Dutch (95.5%, a difference of 0.010%), Italian (95.6%, a difference of 0.020%), Scandinavian (95.6%, a difference of 0.020%), Latvian (95.6%, a difference of 0.030%), and Scottish (95.6%, a difference of 0.040%).
| Demographics | Rating | Rank | 10th Grade |
| English | 100.0 /100 | #13 | Exceptional 95.6% |
| Tsimshian | 100.0 /100 | #14 | Exceptional 95.6% |
| Irish | 100.0 /100 | #15 | Exceptional 95.6% |
| Scottish | 100.0 /100 | #16 | Exceptional 95.6% |
| Latvians | 100.0 /100 | #17 | Exceptional 95.6% |
| Italians | 100.0 /100 | #18 | Exceptional 95.6% |
| Scandinavians | 100.0 /100 | #19 | Exceptional 95.6% |
| Chinese | 100.0 /100 | #20 | Exceptional 95.5% |
| Dutch | 100.0 /100 | #21 | Exceptional 95.5% |
| Eastern Europeans | 100.0 /100 | #22 | Exceptional 95.5% |
| Czechs | 100.0 /100 | #23 | Exceptional 95.5% |
| Europeans | 100.0 /100 | #24 | Exceptional 95.5% |
| Maltese | 100.0 /100 | #25 | Exceptional 95.5% |
| Welsh | 100.0 /100 | #26 | Exceptional 95.5% |
| Alaskan Athabascans | 100.0 /100 | #27 | Exceptional 95.4% |
Demographics Similar to Immigrants from Ecuador by 10th Grade
In terms of 10th grade, the demographic groups most similar to Immigrants from Ecuador are Ecuadorian (90.6%, a difference of 0.17%), Immigrants from Caribbean (90.6%, a difference of 0.18%), Immigrants from Cuba (90.2%, a difference of 0.23%), Nepalese (90.7%, a difference of 0.26%), and Nicaraguan (90.2%, a difference of 0.31%).
| Demographics | Rating | Rank | 10th Grade |
| Vietnamese | 0.0 /100 | #310 | Tragic 90.9% |
| Immigrants | Cambodia | 0.0 /100 | #311 | Tragic 90.9% |
| Immigrants | Portugal | 0.0 /100 | #312 | Tragic 90.8% |
| Cape Verdeans | 0.0 /100 | #313 | Tragic 90.8% |
| Nepalese | 0.0 /100 | #314 | Tragic 90.7% |
| Immigrants | Caribbean | 0.0 /100 | #315 | Tragic 90.6% |
| Ecuadorians | 0.0 /100 | #316 | Tragic 90.6% |
| Immigrants | Ecuador | 0.0 /100 | #317 | Tragic 90.4% |
| Immigrants | Cuba | 0.0 /100 | #318 | Tragic 90.2% |
| Nicaraguans | 0.0 /100 | #319 | Tragic 90.2% |
| Houma | 0.0 /100 | #320 | Tragic 90.2% |
| Belizeans | 0.0 /100 | #321 | Tragic 90.2% |
| Tohono O'odham | 0.0 /100 | #322 | Tragic 90.1% |
| Immigrants | Belize | 0.0 /100 | #323 | Tragic 90.1% |
| Immigrants | Armenia | 0.0 /100 | #324 | Tragic 89.9% |