Australian vs Immigrants from Ecuador 10th Grade
COMPARE
Australian
Immigrants from Ecuador
10th Grade
10th Grade Comparison
Australians
Immigrants from Ecuador
95.1%
10TH GRADE
99.9/ 100
METRIC RATING
48th/ 347
METRIC RANK
90.4%
10TH GRADE
0.0/ 100
METRIC RATING
317th/ 347
METRIC RANK
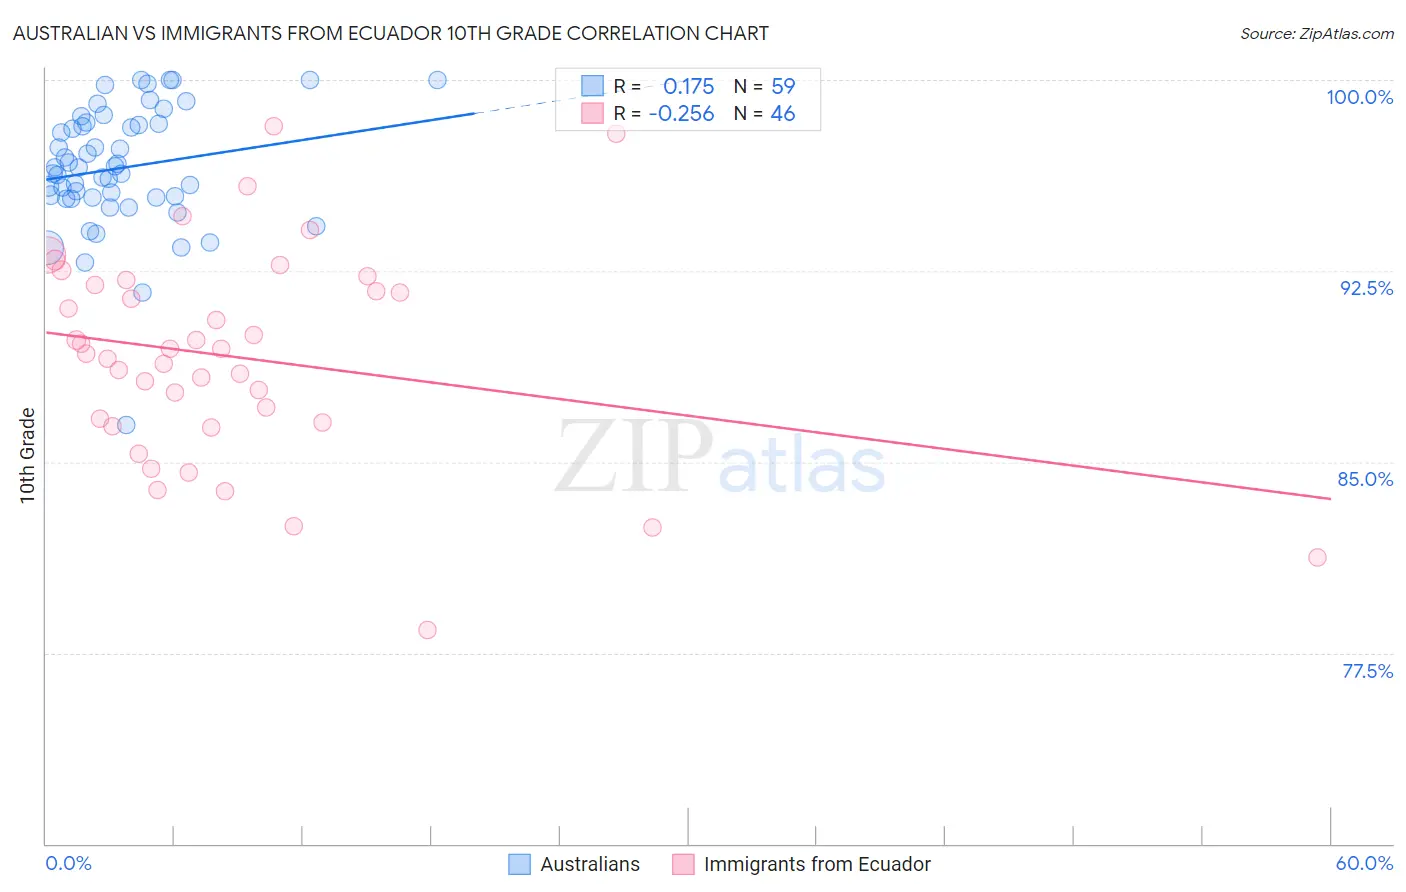
Australian vs Immigrants from Ecuador 10th Grade Correlation Chart
The statistical analysis conducted on geographies consisting of 224,153,693 people shows a poor positive correlation between the proportion of Australians and percentage of population with at least 10th grade education in the United States with a correlation coefficient (R) of 0.175 and weighted average of 95.1%. Similarly, the statistical analysis conducted on geographies consisting of 270,907,929 people shows a weak negative correlation between the proportion of Immigrants from Ecuador and percentage of population with at least 10th grade education in the United States with a correlation coefficient (R) of -0.256 and weighted average of 90.4%, a difference of 5.2%.
10th Grade Correlation Summary
| Measurement | Australian | Immigrants from Ecuador |
| Minimum | 86.5% | 78.4% |
| Maximum | 100.0% | 98.2% |
| Range | 13.5% | 19.8% |
| Mean | 96.5% | 89.1% |
| Median | 96.5% | 89.3% |
| Interquartile 25% (IQ1) | 95.4% | 86.5% |
| Interquartile 75% (IQ3) | 98.3% | 91.9% |
| Interquartile Range (IQR) | 2.9% | 5.4% |
| Standard Deviation (Sample) | 2.4% | 4.2% |
| Standard Deviation (Population) | 2.4% | 4.1% |
Similar Demographics by 10th Grade
Demographics Similar to Australians by 10th Grade
In terms of 10th grade, the demographic groups most similar to Australians are Czechoslovakian (95.1%, a difference of 0.020%), Serbian (95.1%, a difference of 0.020%), Immigrants from Northern Europe (95.2%, a difference of 0.030%), Greek (95.2%, a difference of 0.030%), and Immigrants from Austria (95.1%, a difference of 0.030%).
| Demographics | Rating | Rank | 10th Grade |
| Russians | 99.9 /100 | #41 | Exceptional 95.2% |
| Slavs | 99.9 /100 | #42 | Exceptional 95.2% |
| Macedonians | 99.9 /100 | #43 | Exceptional 95.2% |
| Immigrants | Northern Europe | 99.9 /100 | #44 | Exceptional 95.2% |
| Greeks | 99.9 /100 | #45 | Exceptional 95.2% |
| Czechoslovakians | 99.9 /100 | #46 | Exceptional 95.1% |
| Serbians | 99.9 /100 | #47 | Exceptional 95.1% |
| Australians | 99.9 /100 | #48 | Exceptional 95.1% |
| Immigrants | Austria | 99.9 /100 | #49 | Exceptional 95.1% |
| Immigrants | Canada | 99.8 /100 | #50 | Exceptional 95.1% |
| Austrians | 99.8 /100 | #51 | Exceptional 95.1% |
| Ottawa | 99.8 /100 | #52 | Exceptional 95.1% |
| Immigrants | North America | 99.8 /100 | #53 | Exceptional 95.0% |
| Immigrants | Lithuania | 99.8 /100 | #54 | Exceptional 95.0% |
| Immigrants | Ireland | 99.8 /100 | #55 | Exceptional 95.0% |
Demographics Similar to Immigrants from Ecuador by 10th Grade
In terms of 10th grade, the demographic groups most similar to Immigrants from Ecuador are Ecuadorian (90.6%, a difference of 0.17%), Immigrants from Caribbean (90.6%, a difference of 0.18%), Immigrants from Cuba (90.2%, a difference of 0.23%), Nepalese (90.7%, a difference of 0.26%), and Nicaraguan (90.2%, a difference of 0.31%).
| Demographics | Rating | Rank | 10th Grade |
| Vietnamese | 0.0 /100 | #310 | Tragic 90.9% |
| Immigrants | Cambodia | 0.0 /100 | #311 | Tragic 90.9% |
| Immigrants | Portugal | 0.0 /100 | #312 | Tragic 90.8% |
| Cape Verdeans | 0.0 /100 | #313 | Tragic 90.8% |
| Nepalese | 0.0 /100 | #314 | Tragic 90.7% |
| Immigrants | Caribbean | 0.0 /100 | #315 | Tragic 90.6% |
| Ecuadorians | 0.0 /100 | #316 | Tragic 90.6% |
| Immigrants | Ecuador | 0.0 /100 | #317 | Tragic 90.4% |
| Immigrants | Cuba | 0.0 /100 | #318 | Tragic 90.2% |
| Nicaraguans | 0.0 /100 | #319 | Tragic 90.2% |
| Houma | 0.0 /100 | #320 | Tragic 90.2% |
| Belizeans | 0.0 /100 | #321 | Tragic 90.2% |
| Tohono O'odham | 0.0 /100 | #322 | Tragic 90.1% |
| Immigrants | Belize | 0.0 /100 | #323 | Tragic 90.1% |
| Immigrants | Armenia | 0.0 /100 | #324 | Tragic 89.9% |