Immigrants from Honduras vs Immigrants from Ecuador 10th Grade
COMPARE
Immigrants from Honduras
Immigrants from Ecuador
10th Grade
10th Grade Comparison
Immigrants from Honduras
Immigrants from Ecuador
88.5%
10TH GRADE
0.0/ 100
METRIC RATING
336th/ 347
METRIC RANK
90.4%
10TH GRADE
0.0/ 100
METRIC RATING
317th/ 347
METRIC RANK
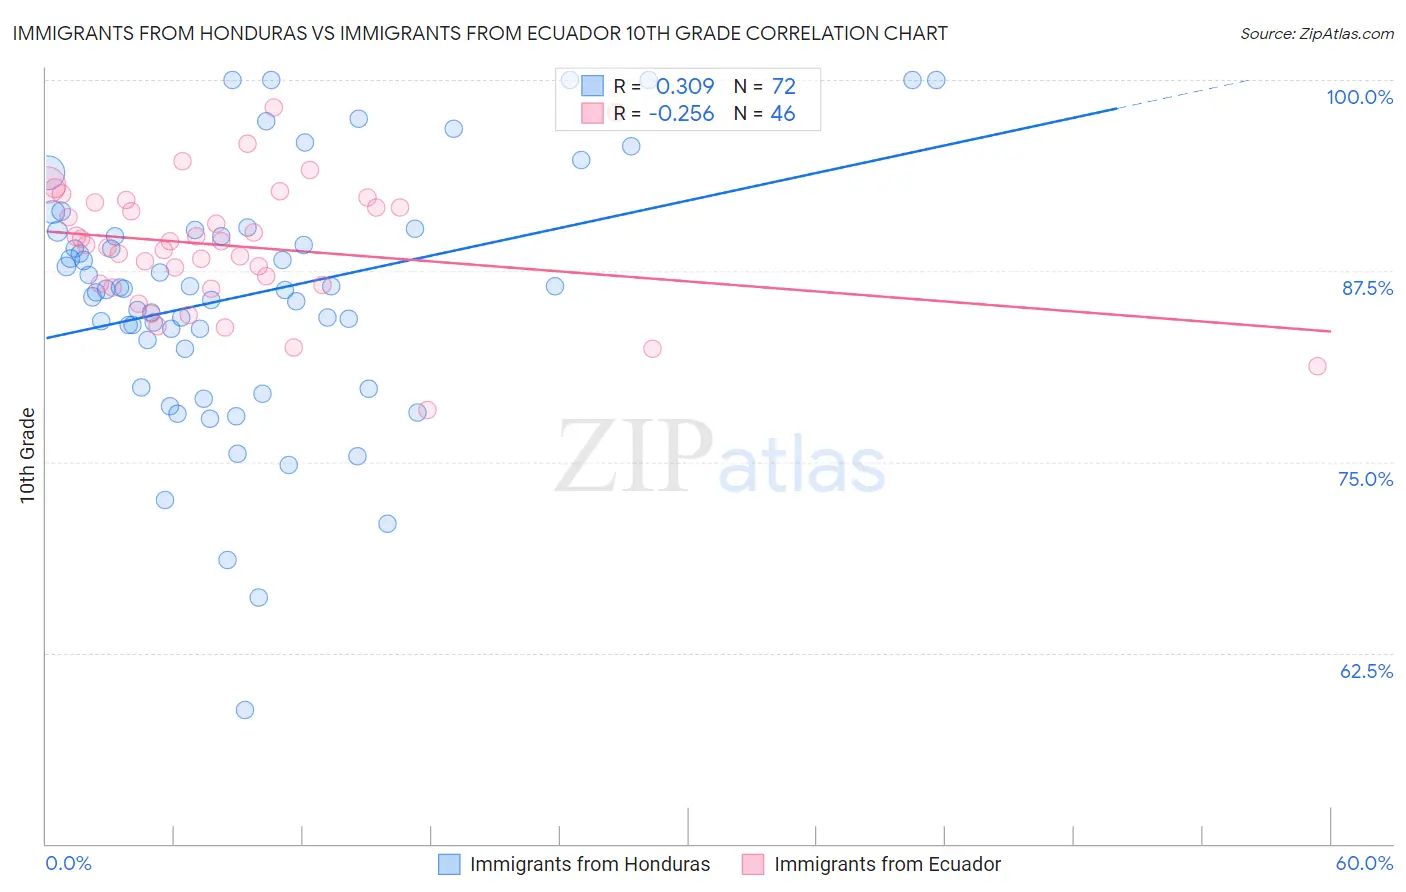
Immigrants from Honduras vs Immigrants from Ecuador 10th Grade Correlation Chart
The statistical analysis conducted on geographies consisting of 322,637,445 people shows a mild positive correlation between the proportion of Immigrants from Honduras and percentage of population with at least 10th grade education in the United States with a correlation coefficient (R) of 0.309 and weighted average of 88.5%. Similarly, the statistical analysis conducted on geographies consisting of 270,907,929 people shows a weak negative correlation between the proportion of Immigrants from Ecuador and percentage of population with at least 10th grade education in the United States with a correlation coefficient (R) of -0.256 and weighted average of 90.4%, a difference of 2.2%.
10th Grade Correlation Summary
| Measurement | Immigrants from Honduras | Immigrants from Ecuador |
| Minimum | 58.7% | 78.4% |
| Maximum | 100.0% | 98.2% |
| Range | 41.3% | 19.8% |
| Mean | 86.0% | 89.1% |
| Median | 86.3% | 89.3% |
| Interquartile 25% (IQ1) | 82.7% | 86.5% |
| Interquartile 75% (IQ3) | 90.2% | 91.9% |
| Interquartile Range (IQR) | 7.5% | 5.4% |
| Standard Deviation (Sample) | 8.2% | 4.2% |
| Standard Deviation (Population) | 8.2% | 4.1% |
Demographics Similar to Immigrants from Honduras and Immigrants from Ecuador by 10th Grade
In terms of 10th grade, the demographic groups most similar to Immigrants from Honduras are Immigrants from Dominican Republic (88.7%, a difference of 0.19%), Hispanic or Latino (88.9%, a difference of 0.37%), Honduran (89.0%, a difference of 0.49%), Immigrants from the Azores (89.0%, a difference of 0.52%), and Mexican American Indian (89.0%, a difference of 0.56%). Similarly, the demographic groups most similar to Immigrants from Ecuador are Ecuadorian (90.6%, a difference of 0.17%), Immigrants from Cuba (90.2%, a difference of 0.23%), Nicaraguan (90.2%, a difference of 0.31%), Houma (90.2%, a difference of 0.32%), and Belizean (90.2%, a difference of 0.32%).
| Demographics | Rating | Rank | 10th Grade |
| Ecuadorians | 0.0 /100 | #316 | Tragic 90.6% |
| Immigrants | Ecuador | 0.0 /100 | #317 | Tragic 90.4% |
| Immigrants | Cuba | 0.0 /100 | #318 | Tragic 90.2% |
| Nicaraguans | 0.0 /100 | #319 | Tragic 90.2% |
| Houma | 0.0 /100 | #320 | Tragic 90.2% |
| Belizeans | 0.0 /100 | #321 | Tragic 90.2% |
| Tohono O'odham | 0.0 /100 | #322 | Tragic 90.1% |
| Immigrants | Belize | 0.0 /100 | #323 | Tragic 90.1% |
| Immigrants | Armenia | 0.0 /100 | #324 | Tragic 89.9% |
| Puerto Ricans | 0.0 /100 | #325 | Tragic 89.8% |
| Central American Indians | 0.0 /100 | #326 | Tragic 89.7% |
| Immigrants | Nicaragua | 0.0 /100 | #327 | Tragic 89.5% |
| Immigrants | Cabo Verde | 0.0 /100 | #328 | Tragic 89.5% |
| Dominicans | 0.0 /100 | #329 | Tragic 89.4% |
| Immigrants | Yemen | 0.0 /100 | #330 | Tragic 89.1% |
| Mexican American Indians | 0.0 /100 | #331 | Tragic 89.0% |
| Immigrants | Azores | 0.0 /100 | #332 | Tragic 89.0% |
| Hondurans | 0.0 /100 | #333 | Tragic 89.0% |
| Hispanics or Latinos | 0.0 /100 | #334 | Tragic 88.9% |
| Immigrants | Dominican Republic | 0.0 /100 | #335 | Tragic 88.7% |
| Immigrants | Honduras | 0.0 /100 | #336 | Tragic 88.5% |