Spanish American vs Subsaharan African Unemployment Among Ages 30 to 34 years
COMPARE
Spanish American
Subsaharan African
Unemployment Among Ages 30 to 34 years
Unemployment Among Ages 30 to 34 years Comparison
Spanish Americans
Sub-Saharan Africans
6.2%
UNEMPLOYMENT AMONG AGES 30 TO 34 YEARS
0.0/ 100
METRIC RATING
263rd/ 347
METRIC RANK
6.0%
UNEMPLOYMENT AMONG AGES 30 TO 34 YEARS
0.3/ 100
METRIC RATING
245th/ 347
METRIC RANK
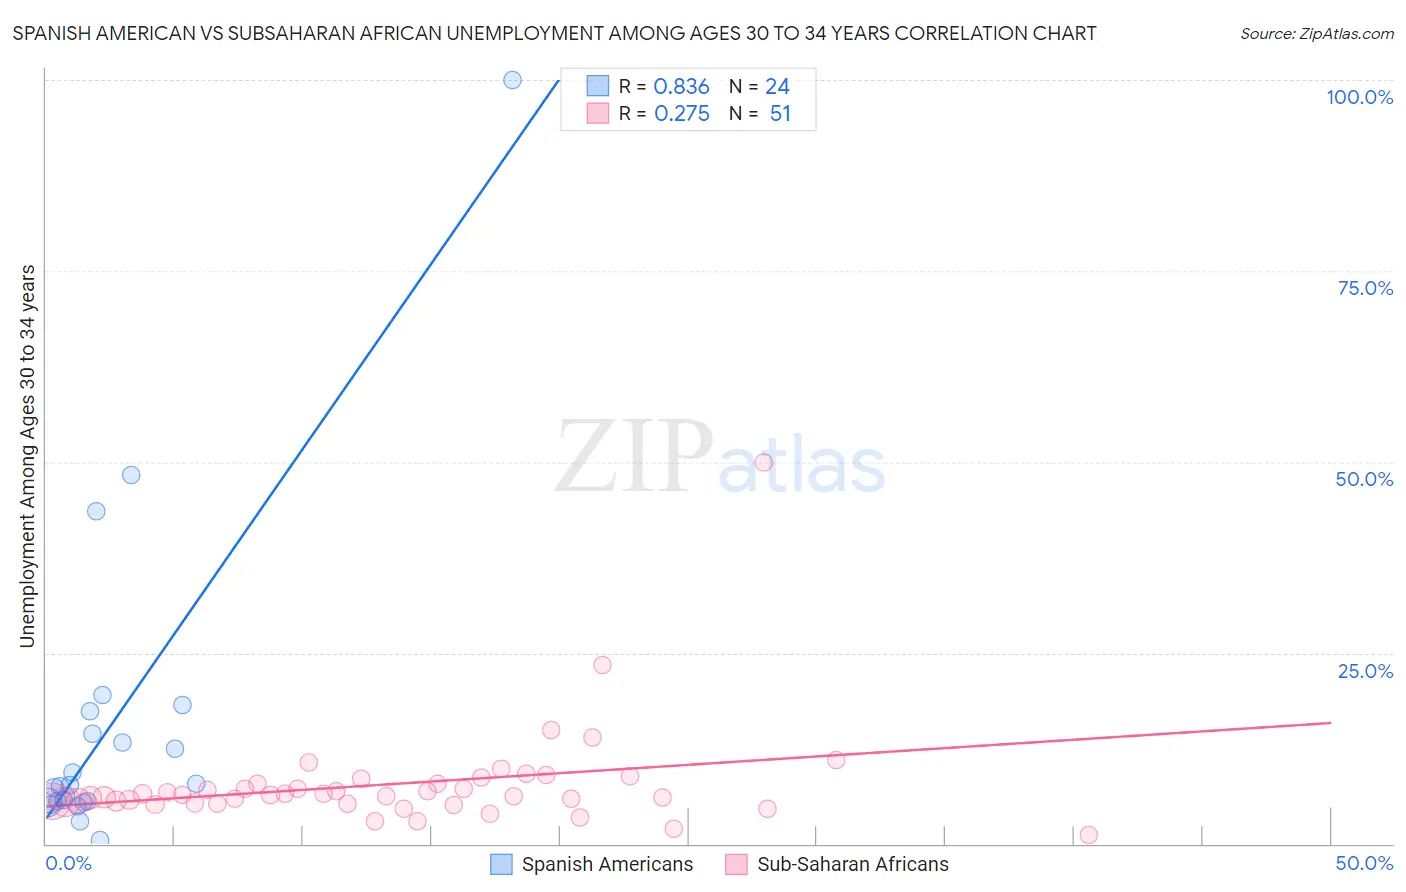
Spanish American vs Subsaharan African Unemployment Among Ages 30 to 34 years Correlation Chart
The statistical analysis conducted on geographies consisting of 101,538,285 people shows a very strong positive correlation between the proportion of Spanish Americans and unemployment rate among population between the ages 30 and 34 in the United States with a correlation coefficient (R) of 0.836 and weighted average of 6.2%. Similarly, the statistical analysis conducted on geographies consisting of 466,998,854 people shows a weak positive correlation between the proportion of Sub-Saharan Africans and unemployment rate among population between the ages 30 and 34 in the United States with a correlation coefficient (R) of 0.275 and weighted average of 6.0%, a difference of 3.3%.
Unemployment Among Ages 30 to 34 years Correlation Summary
| Measurement | Spanish American | Subsaharan African |
| Minimum | 0.50% | 1.2% |
| Maximum | 100.0% | 50.0% |
| Range | 99.5% | 48.8% |
| Mean | 15.6% | 7.8% |
| Median | 7.6% | 6.4% |
| Interquartile 25% (IQ1) | 5.5% | 5.4% |
| Interquartile 75% (IQ3) | 15.9% | 7.9% |
| Interquartile Range (IQR) | 10.4% | 2.6% |
| Standard Deviation (Sample) | 21.4% | 6.9% |
| Standard Deviation (Population) | 20.9% | 6.9% |
Demographics Similar to Spanish Americans and Sub-Saharan Africans by Unemployment Among Ages 30 to 34 years
In terms of unemployment among ages 30 to 34 years, the demographic groups most similar to Spanish Americans are Chickasaw (6.2%, a difference of 0.050%), Immigrants from Central America (6.2%, a difference of 0.50%), Immigrants from Western Africa (6.2%, a difference of 0.68%), Immigrants from Latin America (6.1%, a difference of 0.83%), and Haitian (6.1%, a difference of 1.0%). Similarly, the demographic groups most similar to Sub-Saharan Africans are Immigrants from Micronesia (6.0%, a difference of 0.020%), Ghanaian (6.0%, a difference of 0.18%), Nigerian (6.0%, a difference of 0.25%), Immigrants from Guatemala (6.0%, a difference of 0.25%), and Honduran (6.0%, a difference of 0.25%).
| Demographics | Rating | Rank | Unemployment Among Ages 30 to 34 years |
| Immigrants | Micronesia | 0.3 /100 | #244 | Tragic 6.0% |
| Sub-Saharan Africans | 0.3 /100 | #245 | Tragic 6.0% |
| Ghanaians | 0.3 /100 | #246 | Tragic 6.0% |
| Nigerians | 0.3 /100 | #247 | Tragic 6.0% |
| Immigrants | Guatemala | 0.3 /100 | #248 | Tragic 6.0% |
| Hondurans | 0.3 /100 | #249 | Tragic 6.0% |
| Immigrants | Honduras | 0.3 /100 | #250 | Tragic 6.0% |
| Tlingit-Haida | 0.2 /100 | #251 | Tragic 6.0% |
| Potawatomi | 0.2 /100 | #252 | Tragic 6.0% |
| Immigrants | Nonimmigrants | 0.2 /100 | #253 | Tragic 6.1% |
| Armenians | 0.1 /100 | #254 | Tragic 6.1% |
| Immigrants | Portugal | 0.1 /100 | #255 | Tragic 6.1% |
| Immigrants | Ghana | 0.1 /100 | #256 | Tragic 6.1% |
| Immigrants | Sierra Leone | 0.1 /100 | #257 | Tragic 6.1% |
| Mexicans | 0.1 /100 | #258 | Tragic 6.1% |
| Haitians | 0.1 /100 | #259 | Tragic 6.1% |
| Immigrants | Latin America | 0.1 /100 | #260 | Tragic 6.1% |
| Immigrants | Western Africa | 0.1 /100 | #261 | Tragic 6.2% |
| Immigrants | Central America | 0.1 /100 | #262 | Tragic 6.2% |
| Spanish Americans | 0.0 /100 | #263 | Tragic 6.2% |
| Chickasaw | 0.0 /100 | #264 | Tragic 6.2% |