Spanish American vs French Canadian Professional Degree
COMPARE
Spanish American
French Canadian
Professional Degree
Professional Degree Comparison
Spanish Americans
French Canadians
3.9%
PROFESSIONAL DEGREE
3.8/ 100
METRIC RATING
236th/ 347
METRIC RANK
4.0%
PROFESSIONAL DEGREE
8.0/ 100
METRIC RATING
221st/ 347
METRIC RANK
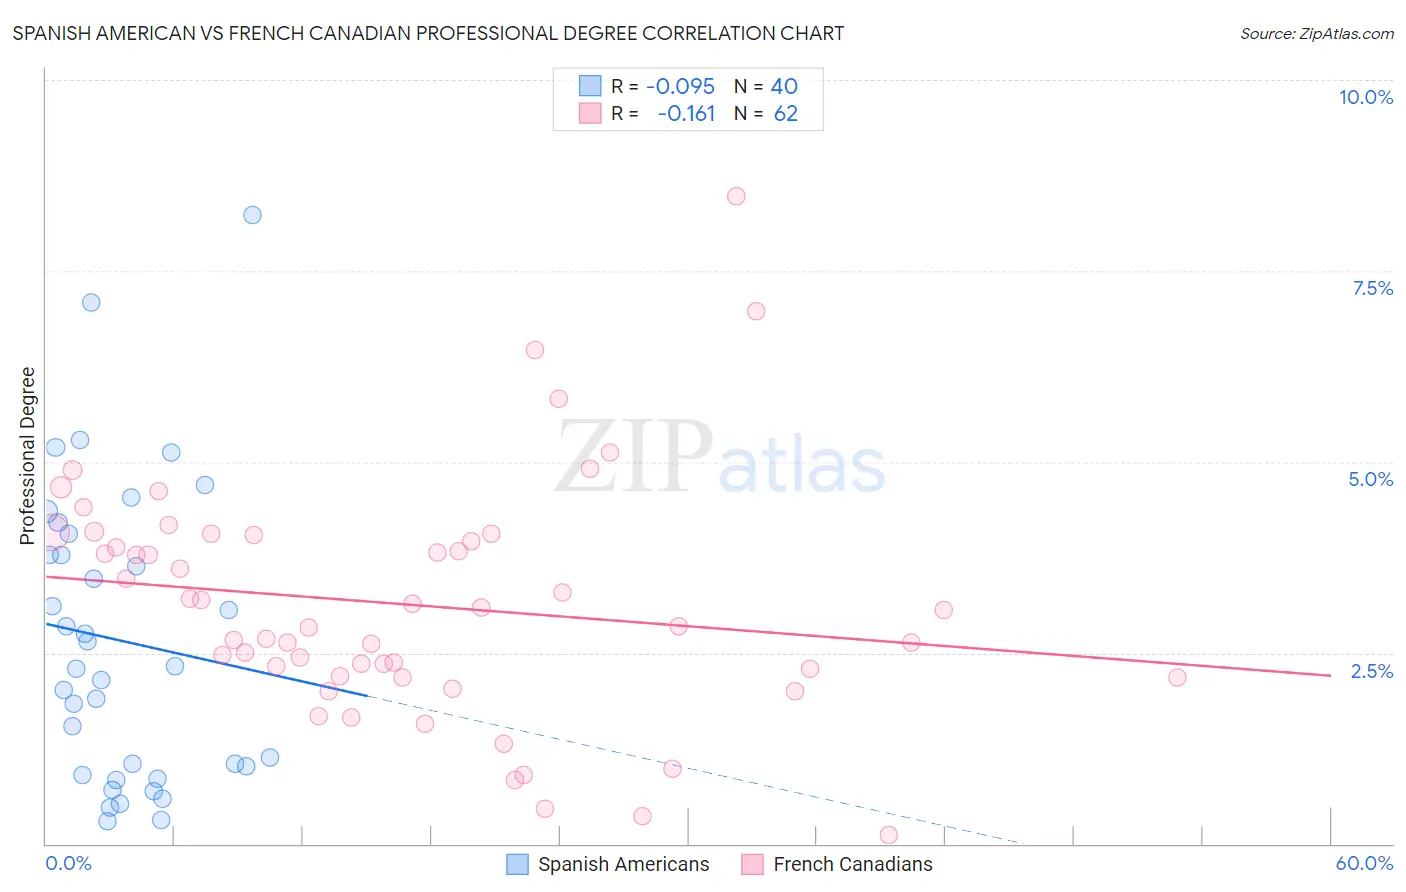
Spanish American vs French Canadian Professional Degree Correlation Chart
The statistical analysis conducted on geographies consisting of 103,063,360 people shows a slight negative correlation between the proportion of Spanish Americans and percentage of population with at least professional degree education in the United States with a correlation coefficient (R) of -0.095 and weighted average of 3.9%. Similarly, the statistical analysis conducted on geographies consisting of 499,387,029 people shows a poor negative correlation between the proportion of French Canadians and percentage of population with at least professional degree education in the United States with a correlation coefficient (R) of -0.161 and weighted average of 4.0%, a difference of 3.2%.
Professional Degree Correlation Summary
| Measurement | Spanish American | French Canadian |
| Minimum | 0.30% | 0.11% |
| Maximum | 8.2% | 8.5% |
| Range | 7.9% | 8.4% |
| Mean | 2.7% | 3.1% |
| Median | 2.3% | 3.0% |
| Interquartile 25% (IQ1) | 0.95% | 2.2% |
| Interquartile 75% (IQ3) | 3.9% | 4.0% |
| Interquartile Range (IQR) | 3.0% | 1.8% |
| Standard Deviation (Sample) | 1.9% | 1.6% |
| Standard Deviation (Population) | 1.9% | 1.5% |
Demographics Similar to Spanish Americans and French Canadians by Professional Degree
In terms of professional degree, the demographic groups most similar to Spanish Americans are Immigrants from Trinidad and Tobago (3.9%, a difference of 0.070%), Immigrants from Barbados (3.9%, a difference of 0.22%), Nonimmigrants (3.9%, a difference of 0.23%), Immigrants from Philippines (3.9%, a difference of 0.28%), and Cree (3.9%, a difference of 0.53%). Similarly, the demographic groups most similar to French Canadians are Ute (4.0%, a difference of 0.13%), Immigrants from Western Africa (4.0%, a difference of 0.25%), Immigrants from Bosnia and Herzegovina (4.0%, a difference of 0.33%), Trinidadian and Tobagonian (4.0%, a difference of 0.47%), and Immigrants from South Eastern Asia (4.0%, a difference of 0.49%).
| Demographics | Rating | Rank | Professional Degree |
| Dutch | 9.0 /100 | #218 | Tragic 4.0% |
| Immigrants | South Eastern Asia | 8.9 /100 | #219 | Tragic 4.0% |
| Ute | 8.2 /100 | #220 | Tragic 4.0% |
| French Canadians | 8.0 /100 | #221 | Tragic 4.0% |
| Immigrants | Western Africa | 7.5 /100 | #222 | Tragic 4.0% |
| Immigrants | Bosnia and Herzegovina | 7.4 /100 | #223 | Tragic 4.0% |
| Trinidadians and Tobagonians | 7.1 /100 | #224 | Tragic 4.0% |
| Tlingit-Haida | 6.9 /100 | #225 | Tragic 4.0% |
| German Russians | 6.1 /100 | #226 | Tragic 4.0% |
| Cubans | 5.9 /100 | #227 | Tragic 4.0% |
| Immigrants | West Indies | 5.6 /100 | #228 | Tragic 4.0% |
| Immigrants | Burma/Myanmar | 5.4 /100 | #229 | Tragic 3.9% |
| Nicaraguans | 5.1 /100 | #230 | Tragic 3.9% |
| Ecuadorians | 4.6 /100 | #231 | Tragic 3.9% |
| Cree | 4.3 /100 | #232 | Tragic 3.9% |
| Immigrants | Philippines | 4.1 /100 | #233 | Tragic 3.9% |
| Immigrants | Nonimmigrants | 4.0 /100 | #234 | Tragic 3.9% |
| Immigrants | Barbados | 4.0 /100 | #235 | Tragic 3.9% |
| Spanish Americans | 3.8 /100 | #236 | Tragic 3.9% |
| Immigrants | Trinidad and Tobago | 3.8 /100 | #237 | Tragic 3.9% |
| Colville | 2.6 /100 | #238 | Tragic 3.8% |