Spanish American vs Subsaharan African Male Unemployment
COMPARE
Spanish American
Subsaharan African
Male Unemployment
Male Unemployment Comparison
Spanish Americans
Sub-Saharan Africans
5.7%
MALE UNEMPLOYMENT
0.3/ 100
METRIC RATING
251st/ 347
METRIC RANK
6.0%
MALE UNEMPLOYMENT
0.0/ 100
METRIC RATING
270th/ 347
METRIC RANK
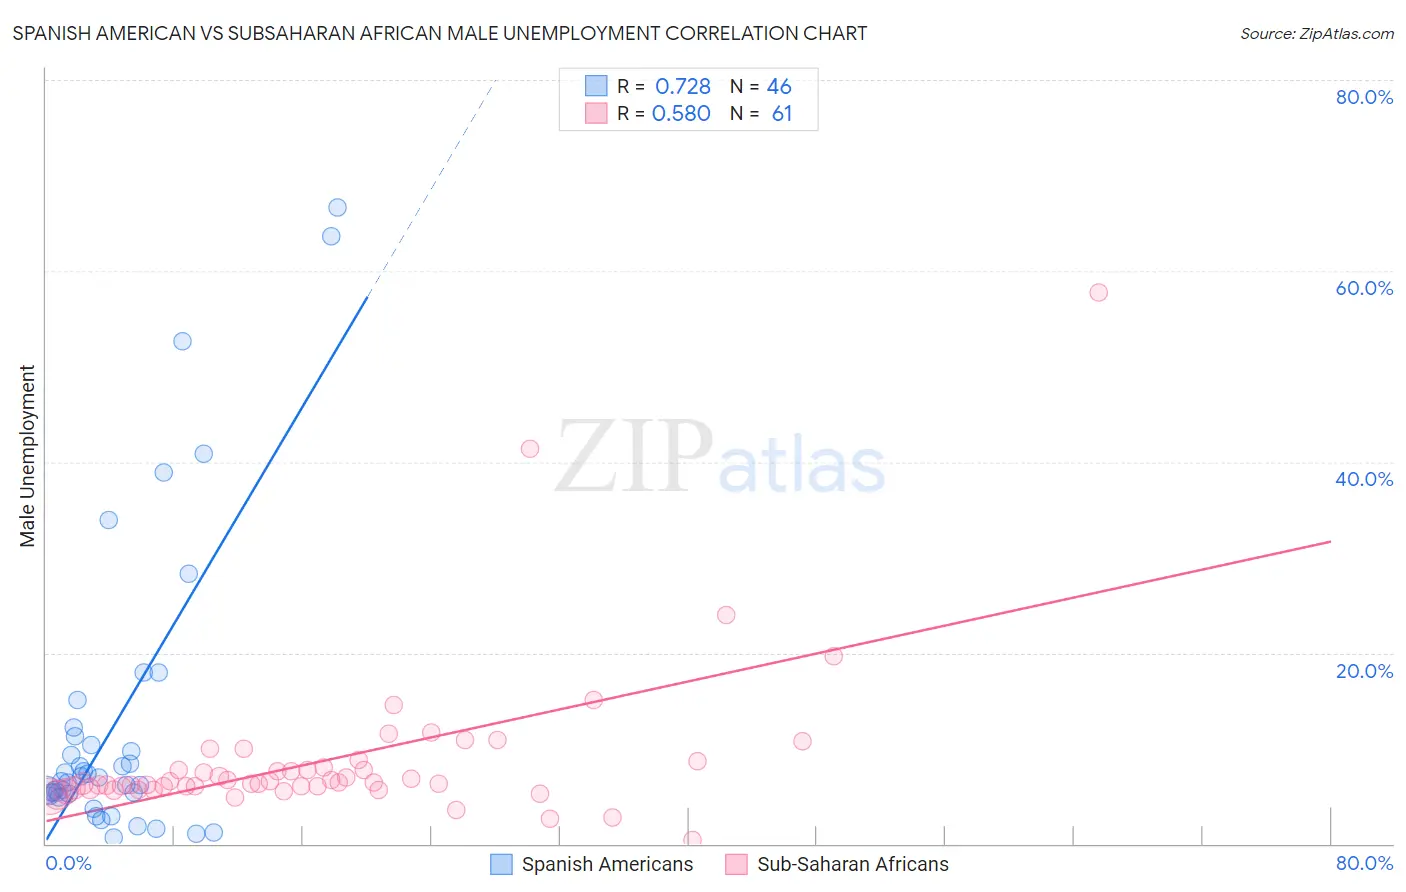
Spanish American vs Subsaharan African Male Unemployment Correlation Chart
The statistical analysis conducted on geographies consisting of 103,047,873 people shows a strong positive correlation between the proportion of Spanish Americans and unemployment rate among males in the United States with a correlation coefficient (R) of 0.728 and weighted average of 5.7%. Similarly, the statistical analysis conducted on geographies consisting of 504,185,655 people shows a substantial positive correlation between the proportion of Sub-Saharan Africans and unemployment rate among males in the United States with a correlation coefficient (R) of 0.580 and weighted average of 6.0%, a difference of 4.0%.
Male Unemployment Correlation Summary
| Measurement | Spanish American | Subsaharan African |
| Minimum | 0.60% | 0.40% |
| Maximum | 66.7% | 57.8% |
| Range | 66.1% | 57.4% |
| Mean | 12.8% | 8.9% |
| Median | 6.7% | 6.4% |
| Interquartile 25% (IQ1) | 5.2% | 5.8% |
| Interquartile 75% (IQ3) | 11.3% | 8.3% |
| Interquartile Range (IQR) | 6.1% | 2.5% |
| Standard Deviation (Sample) | 15.8% | 8.5% |
| Standard Deviation (Population) | 15.7% | 8.5% |
Demographics Similar to Spanish Americans and Sub-Saharan Africans by Male Unemployment
In terms of male unemployment, the demographic groups most similar to Spanish Americans are Immigrants from Bahamas (5.7%, a difference of 0.040%), Mexican (5.8%, a difference of 0.57%), Mexican American Indian (5.8%, a difference of 0.71%), Japanese (5.8%, a difference of 0.88%), and Kiowa (5.8%, a difference of 0.99%). Similarly, the demographic groups most similar to Sub-Saharan Africans are Immigrants from Nigeria (6.0%, a difference of 0.13%), Bermudan (5.9%, a difference of 0.40%), Nigerian (5.9%, a difference of 0.61%), Bahamian (5.9%, a difference of 0.74%), and French American Indian (5.9%, a difference of 0.87%).
| Demographics | Rating | Rank | Male Unemployment |
| Immigrants | Bahamas | 0.4 /100 | #250 | Tragic 5.7% |
| Spanish Americans | 0.3 /100 | #251 | Tragic 5.7% |
| Mexicans | 0.2 /100 | #252 | Tragic 5.8% |
| Mexican American Indians | 0.2 /100 | #253 | Tragic 5.8% |
| Japanese | 0.2 /100 | #254 | Tragic 5.8% |
| Kiowa | 0.2 /100 | #255 | Tragic 5.8% |
| Comanche | 0.2 /100 | #256 | Tragic 5.8% |
| Hispanics or Latinos | 0.1 /100 | #257 | Tragic 5.8% |
| Dutch West Indians | 0.1 /100 | #258 | Tragic 5.8% |
| Cajuns | 0.1 /100 | #259 | Tragic 5.8% |
| Immigrants | Central America | 0.1 /100 | #260 | Tragic 5.8% |
| Liberians | 0.1 /100 | #261 | Tragic 5.8% |
| Immigrants | Portugal | 0.1 /100 | #262 | Tragic 5.9% |
| Immigrants | Latin America | 0.1 /100 | #263 | Tragic 5.9% |
| Immigrants | Mexico | 0.0 /100 | #264 | Tragic 5.9% |
| French American Indians | 0.0 /100 | #265 | Tragic 5.9% |
| Bahamians | 0.0 /100 | #266 | Tragic 5.9% |
| Nigerians | 0.0 /100 | #267 | Tragic 5.9% |
| Bermudans | 0.0 /100 | #268 | Tragic 5.9% |
| Immigrants | Nigeria | 0.0 /100 | #269 | Tragic 6.0% |
| Sub-Saharan Africans | 0.0 /100 | #270 | Tragic 6.0% |