Spanish American vs Immigrants from West Indies 10th Grade
COMPARE
Spanish American
Immigrants from West Indies
10th Grade
10th Grade Comparison
Spanish Americans
Immigrants from West Indies
92.9%
10TH GRADE
2.1/ 100
METRIC RATING
244th/ 347
METRIC RANK
91.8%
10TH GRADE
0.0/ 100
METRIC RATING
291st/ 347
METRIC RANK
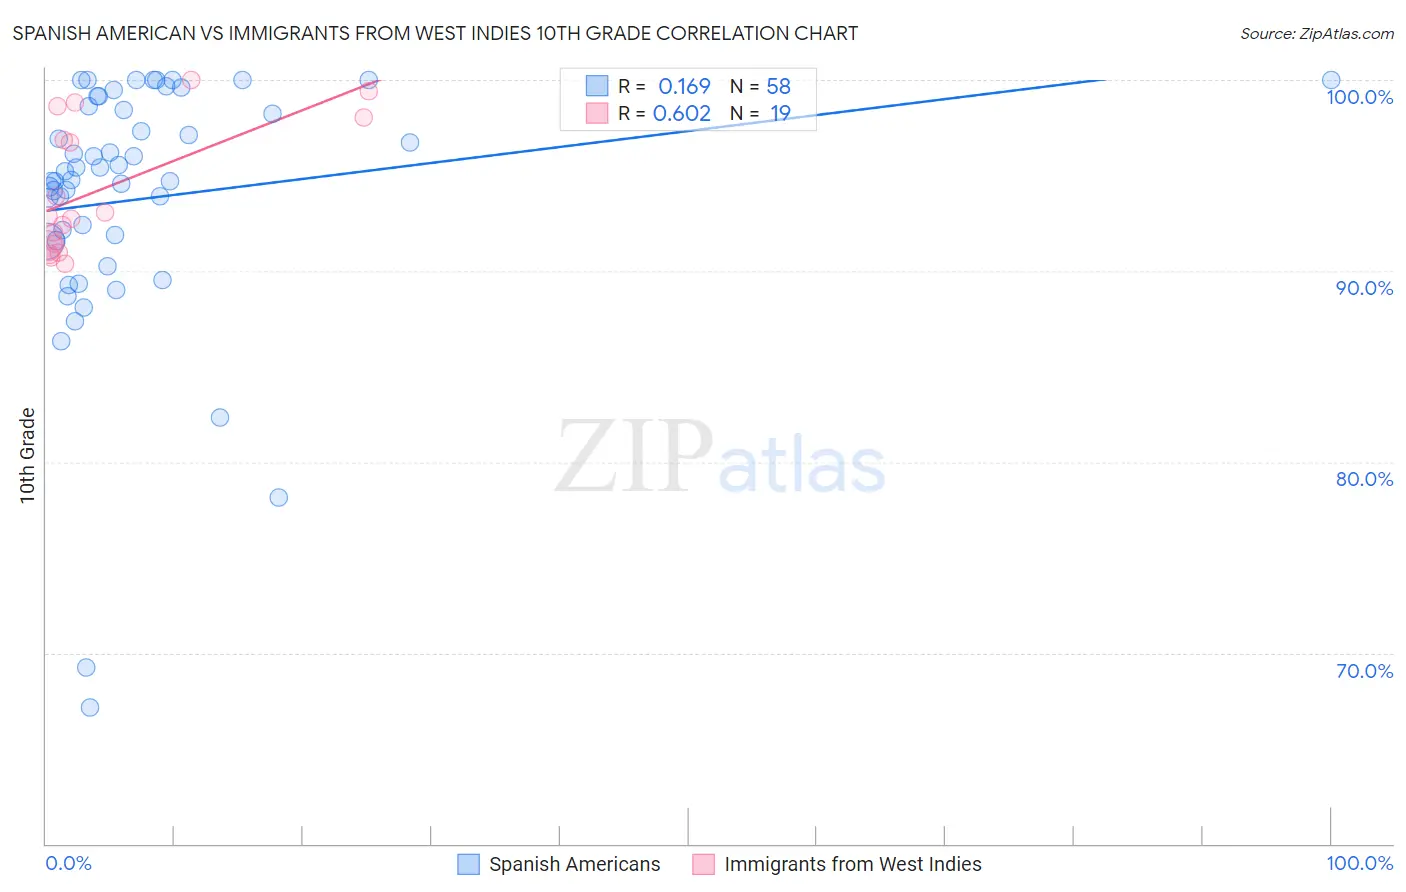
Spanish American vs Immigrants from West Indies 10th Grade Correlation Chart
The statistical analysis conducted on geographies consisting of 103,166,592 people shows a poor positive correlation between the proportion of Spanish Americans and percentage of population with at least 10th grade education in the United States with a correlation coefficient (R) of 0.169 and weighted average of 92.9%. Similarly, the statistical analysis conducted on geographies consisting of 72,457,514 people shows a significant positive correlation between the proportion of Immigrants from West Indies and percentage of population with at least 10th grade education in the United States with a correlation coefficient (R) of 0.602 and weighted average of 91.8%, a difference of 1.2%.
10th Grade Correlation Summary
| Measurement | Spanish American | Immigrants from West Indies |
| Minimum | 67.1% | 90.4% |
| Maximum | 100.0% | 100.0% |
| Range | 32.9% | 9.6% |
| Mean | 93.8% | 94.3% |
| Median | 95.0% | 92.8% |
| Interquartile 25% (IQ1) | 91.6% | 91.3% |
| Interquartile 75% (IQ3) | 98.7% | 98.0% |
| Interquartile Range (IQR) | 7.1% | 6.7% |
| Standard Deviation (Sample) | 6.8% | 3.4% |
| Standard Deviation (Population) | 6.7% | 3.3% |
Similar Demographics by 10th Grade
Demographics Similar to Spanish Americans by 10th Grade
In terms of 10th grade, the demographic groups most similar to Spanish Americans are Senegalese (93.0%, a difference of 0.030%), Uruguayan (92.9%, a difference of 0.030%), Immigrants from Cameroon (93.0%, a difference of 0.050%), Immigrants from Middle Africa (92.9%, a difference of 0.050%), and Immigrants from Somalia (93.0%, a difference of 0.060%).
| Demographics | Rating | Rank | 10th Grade |
| Immigrants | Panama | 4.3 /100 | #237 | Tragic 93.1% |
| Nigerians | 4.2 /100 | #238 | Tragic 93.1% |
| Costa Ricans | 4.2 /100 | #239 | Tragic 93.1% |
| Immigrants | Hong Kong | 4.2 /100 | #240 | Tragic 93.1% |
| Immigrants | Somalia | 2.7 /100 | #241 | Tragic 93.0% |
| Immigrants | Cameroon | 2.6 /100 | #242 | Tragic 93.0% |
| Senegalese | 2.4 /100 | #243 | Tragic 93.0% |
| Spanish Americans | 2.1 /100 | #244 | Tragic 92.9% |
| Uruguayans | 1.8 /100 | #245 | Tragic 92.9% |
| Immigrants | Middle Africa | 1.7 /100 | #246 | Tragic 92.9% |
| Immigrants | Afghanistan | 1.4 /100 | #247 | Tragic 92.8% |
| Colombians | 1.4 /100 | #248 | Tragic 92.8% |
| Immigrants | Senegal | 1.4 /100 | #249 | Tragic 92.8% |
| Jamaicans | 1.2 /100 | #250 | Tragic 92.8% |
| Immigrants | Thailand | 1.0 /100 | #251 | Tragic 92.8% |
Demographics Similar to Immigrants from West Indies by 10th Grade
In terms of 10th grade, the demographic groups most similar to Immigrants from West Indies are British West Indian (91.8%, a difference of 0.0%), Immigrants from Burma/Myanmar (91.8%, a difference of 0.0%), Indonesian (91.8%, a difference of 0.020%), Sri Lankan (91.8%, a difference of 0.030%), and Pennsylvania German (91.9%, a difference of 0.060%).
| Demographics | Rating | Rank | 10th Grade |
| Immigrants | Barbados | 0.0 /100 | #284 | Tragic 92.1% |
| Immigrants | South Eastern Asia | 0.0 /100 | #285 | Tragic 92.1% |
| Yuman | 0.0 /100 | #286 | Tragic 92.0% |
| Pennsylvania Germans | 0.0 /100 | #287 | Tragic 91.9% |
| Immigrants | Laos | 0.0 /100 | #288 | Tragic 91.9% |
| Sri Lankans | 0.0 /100 | #289 | Tragic 91.8% |
| British West Indians | 0.0 /100 | #290 | Tragic 91.8% |
| Immigrants | West Indies | 0.0 /100 | #291 | Tragic 91.8% |
| Immigrants | Burma/Myanmar | 0.0 /100 | #292 | Tragic 91.8% |
| Indonesians | 0.0 /100 | #293 | Tragic 91.8% |
| Haitians | 0.0 /100 | #294 | Tragic 91.8% |
| Lumbee | 0.0 /100 | #295 | Tragic 91.7% |
| Immigrants | Grenada | 0.0 /100 | #296 | Tragic 91.6% |
| Fijians | 0.0 /100 | #297 | Tragic 91.5% |
| Cubans | 0.0 /100 | #298 | Tragic 91.5% |