Spanish American vs Immigrants from West Indies Disability Age 65 to 74
COMPARE
Spanish American
Immigrants from West Indies
Disability Age 65 to 74
Disability Age 65 to 74 Comparison
Spanish Americans
Immigrants from West Indies
25.9%
DISABILITY AGE 65 TO 74
0.0/ 100
METRIC RATING
283rd/ 347
METRIC RANK
23.9%
DISABILITY AGE 65 TO 74
15.9/ 100
METRIC RATING
211th/ 347
METRIC RANK
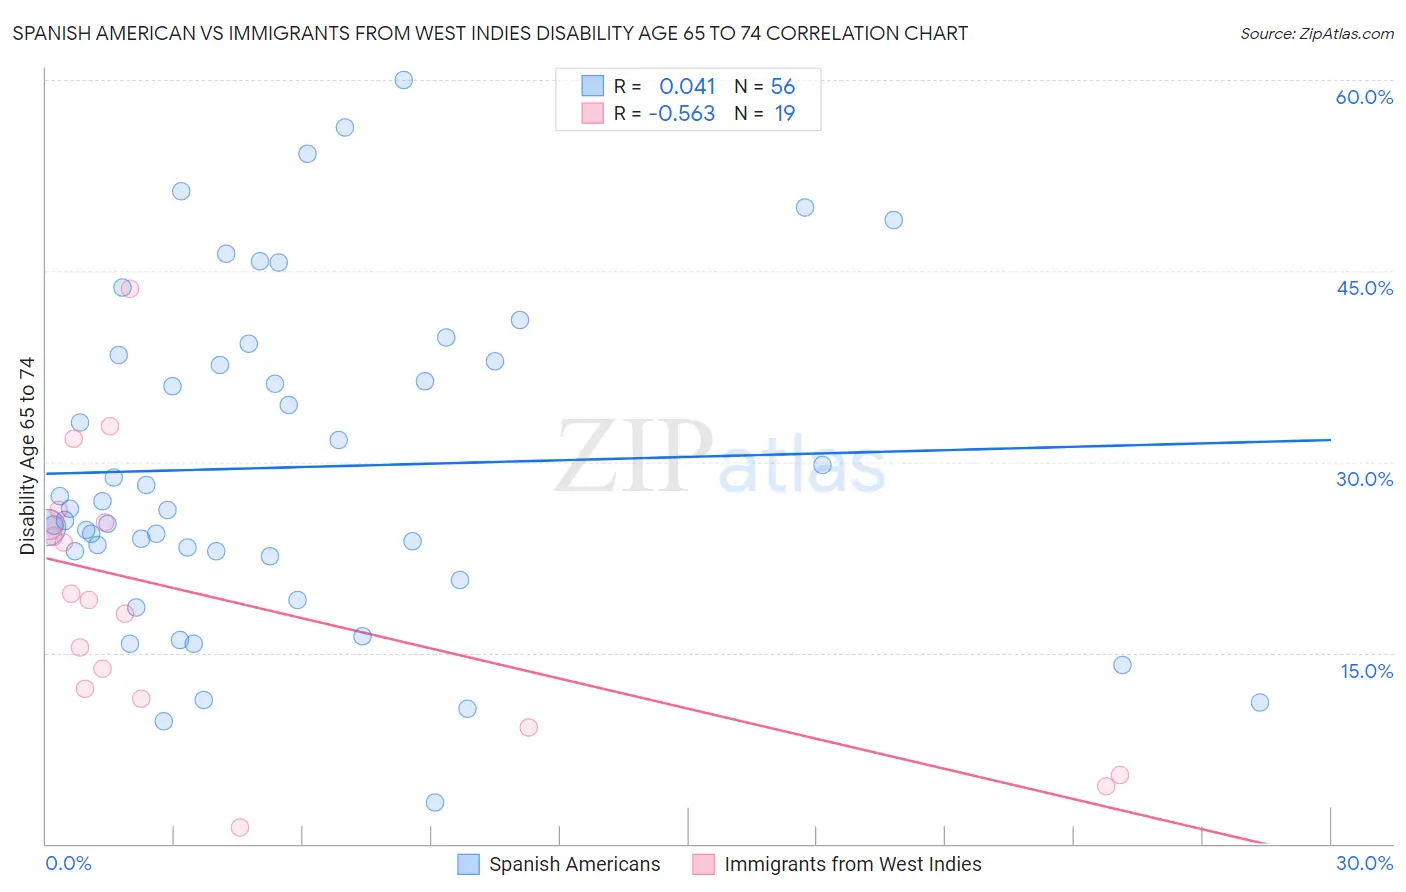
Spanish American vs Immigrants from West Indies Disability Age 65 to 74 Correlation Chart
The statistical analysis conducted on geographies consisting of 103,158,709 people shows no correlation between the proportion of Spanish Americans and percentage of population with a disability between the ages 65 and 75 in the United States with a correlation coefficient (R) of 0.041 and weighted average of 25.9%. Similarly, the statistical analysis conducted on geographies consisting of 72,453,318 people shows a substantial negative correlation between the proportion of Immigrants from West Indies and percentage of population with a disability between the ages 65 and 75 in the United States with a correlation coefficient (R) of -0.563 and weighted average of 23.9%, a difference of 8.6%.
Disability Age 65 to 74 Correlation Summary
| Measurement | Spanish American | Immigrants from West Indies |
| Minimum | 3.2% | 1.3% |
| Maximum | 60.0% | 43.6% |
| Range | 56.8% | 42.3% |
| Mean | 29.6% | 19.1% |
| Median | 26.3% | 19.1% |
| Interquartile 25% (IQ1) | 22.8% | 11.4% |
| Interquartile 75% (IQ3) | 38.1% | 25.2% |
| Interquartile Range (IQR) | 15.3% | 13.9% |
| Standard Deviation (Sample) | 12.9% | 10.8% |
| Standard Deviation (Population) | 12.8% | 10.5% |
Similar Demographics by Disability Age 65 to 74
Demographics Similar to Spanish Americans by Disability Age 65 to 74
In terms of disability age 65 to 74, the demographic groups most similar to Spanish Americans are Delaware (25.9%, a difference of 0.14%), Immigrants from the Azores (26.0%, a difference of 0.19%), Immigrants from Honduras (25.9%, a difference of 0.21%), Immigrants from Congo (26.0%, a difference of 0.21%), and Cree (25.9%, a difference of 0.24%).
| Demographics | Rating | Rank | Disability Age 65 to 74 |
| French American Indians | 0.1 /100 | #276 | Tragic 25.8% |
| Belizeans | 0.1 /100 | #277 | Tragic 25.8% |
| Immigrants | Belize | 0.1 /100 | #278 | Tragic 25.8% |
| U.S. Virgin Islanders | 0.1 /100 | #279 | Tragic 25.9% |
| Cree | 0.1 /100 | #280 | Tragic 25.9% |
| Immigrants | Honduras | 0.1 /100 | #281 | Tragic 25.9% |
| Delaware | 0.1 /100 | #282 | Tragic 25.9% |
| Spanish Americans | 0.0 /100 | #283 | Tragic 25.9% |
| Immigrants | Azores | 0.0 /100 | #284 | Tragic 26.0% |
| Immigrants | Congo | 0.0 /100 | #285 | Tragic 26.0% |
| Immigrants | Micronesia | 0.0 /100 | #286 | Tragic 26.1% |
| Immigrants | Laos | 0.0 /100 | #287 | Tragic 26.1% |
| Mexican American Indians | 0.0 /100 | #288 | Tragic 26.2% |
| Africans | 0.0 /100 | #289 | Tragic 26.2% |
| Immigrants | Cabo Verde | 0.0 /100 | #290 | Tragic 26.3% |
Demographics Similar to Immigrants from West Indies by Disability Age 65 to 74
In terms of disability age 65 to 74, the demographic groups most similar to Immigrants from West Indies are French (23.9%, a difference of 0.020%), Trinidadian and Tobagonian (23.9%, a difference of 0.050%), Nicaraguan (23.9%, a difference of 0.19%), Immigrants from Oceania (24.0%, a difference of 0.26%), and Pennsylvania German (24.0%, a difference of 0.31%).
| Demographics | Rating | Rank | Disability Age 65 to 74 |
| Immigrants | Grenada | 22.1 /100 | #204 | Fair 23.8% |
| Tongans | 20.8 /100 | #205 | Fair 23.8% |
| Immigrants | Jamaica | 20.7 /100 | #206 | Fair 23.8% |
| Immigrants | Sudan | 20.1 /100 | #207 | Fair 23.8% |
| Immigrants | Barbados | 19.6 /100 | #208 | Poor 23.8% |
| Immigrants | Kenya | 19.6 /100 | #209 | Poor 23.8% |
| Trinidadians and Tobagonians | 16.4 /100 | #210 | Poor 23.9% |
| Immigrants | West Indies | 15.9 /100 | #211 | Poor 23.9% |
| French | 15.7 /100 | #212 | Poor 23.9% |
| Nicaraguans | 14.3 /100 | #213 | Poor 23.9% |
| Immigrants | Oceania | 13.6 /100 | #214 | Poor 24.0% |
| Pennsylvania Germans | 13.3 /100 | #215 | Poor 24.0% |
| Jamaicans | 12.2 /100 | #216 | Poor 24.0% |
| Immigrants | Portugal | 11.7 /100 | #217 | Poor 24.0% |
| Immigrants | Nigeria | 11.7 /100 | #218 | Poor 24.0% |