Spanish American vs Immigrants from Belarus 10th Grade
COMPARE
Spanish American
Immigrants from Belarus
10th Grade
10th Grade Comparison
Spanish Americans
Immigrants from Belarus
92.9%
10TH GRADE
2.1/ 100
METRIC RATING
244th/ 347
METRIC RANK
94.4%
10TH GRADE
95.2/ 100
METRIC RATING
121st/ 347
METRIC RANK
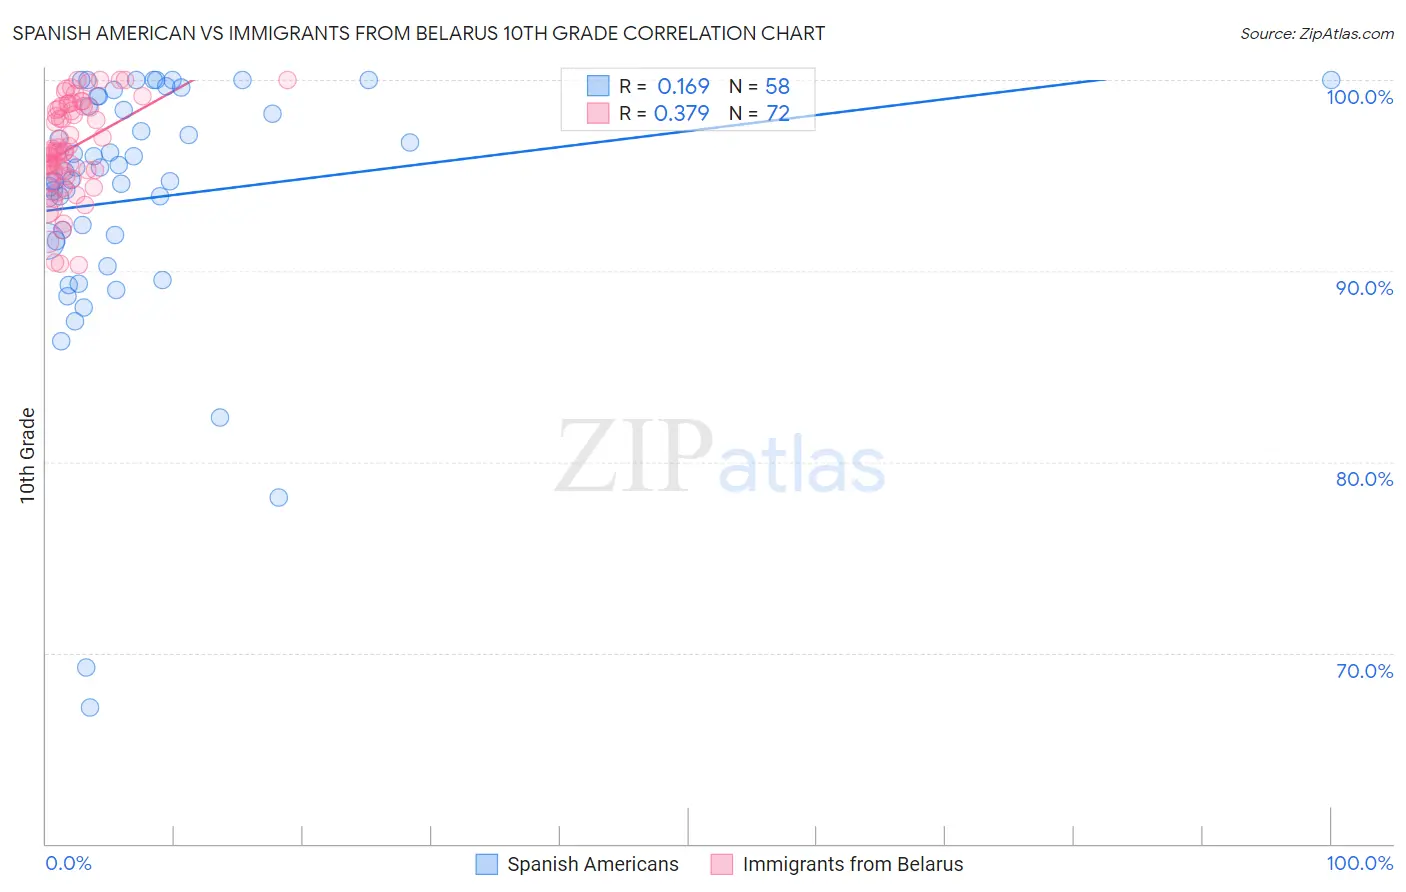
Spanish American vs Immigrants from Belarus 10th Grade Correlation Chart
The statistical analysis conducted on geographies consisting of 103,166,592 people shows a poor positive correlation between the proportion of Spanish Americans and percentage of population with at least 10th grade education in the United States with a correlation coefficient (R) of 0.169 and weighted average of 92.9%. Similarly, the statistical analysis conducted on geographies consisting of 149,993,317 people shows a mild positive correlation between the proportion of Immigrants from Belarus and percentage of population with at least 10th grade education in the United States with a correlation coefficient (R) of 0.379 and weighted average of 94.4%, a difference of 1.5%.
10th Grade Correlation Summary
| Measurement | Spanish American | Immigrants from Belarus |
| Minimum | 67.1% | 90.3% |
| Maximum | 100.0% | 100.0% |
| Range | 32.9% | 9.7% |
| Mean | 93.8% | 96.4% |
| Median | 95.0% | 96.3% |
| Interquartile 25% (IQ1) | 91.6% | 95.2% |
| Interquartile 75% (IQ3) | 98.7% | 98.6% |
| Interquartile Range (IQR) | 7.1% | 3.4% |
| Standard Deviation (Sample) | 6.8% | 2.5% |
| Standard Deviation (Population) | 6.7% | 2.5% |
Similar Demographics by 10th Grade
Demographics Similar to Spanish Americans by 10th Grade
In terms of 10th grade, the demographic groups most similar to Spanish Americans are Senegalese (93.0%, a difference of 0.030%), Uruguayan (92.9%, a difference of 0.030%), Immigrants from Cameroon (93.0%, a difference of 0.050%), Immigrants from Middle Africa (92.9%, a difference of 0.050%), and Immigrants from Somalia (93.0%, a difference of 0.060%).
| Demographics | Rating | Rank | 10th Grade |
| Immigrants | Panama | 4.3 /100 | #237 | Tragic 93.1% |
| Nigerians | 4.2 /100 | #238 | Tragic 93.1% |
| Costa Ricans | 4.2 /100 | #239 | Tragic 93.1% |
| Immigrants | Hong Kong | 4.2 /100 | #240 | Tragic 93.1% |
| Immigrants | Somalia | 2.7 /100 | #241 | Tragic 93.0% |
| Immigrants | Cameroon | 2.6 /100 | #242 | Tragic 93.0% |
| Senegalese | 2.4 /100 | #243 | Tragic 93.0% |
| Spanish Americans | 2.1 /100 | #244 | Tragic 92.9% |
| Uruguayans | 1.8 /100 | #245 | Tragic 92.9% |
| Immigrants | Middle Africa | 1.7 /100 | #246 | Tragic 92.9% |
| Immigrants | Afghanistan | 1.4 /100 | #247 | Tragic 92.8% |
| Colombians | 1.4 /100 | #248 | Tragic 92.8% |
| Immigrants | Senegal | 1.4 /100 | #249 | Tragic 92.8% |
| Jamaicans | 1.2 /100 | #250 | Tragic 92.8% |
| Immigrants | Thailand | 1.0 /100 | #251 | Tragic 92.8% |
Demographics Similar to Immigrants from Belarus by 10th Grade
In terms of 10th grade, the demographic groups most similar to Immigrants from Belarus are Inupiat (94.4%, a difference of 0.0%), Cree (94.4%, a difference of 0.0%), Immigrants from Israel (94.4%, a difference of 0.010%), Immigrants from Taiwan (94.4%, a difference of 0.010%), and Basque (94.3%, a difference of 0.010%).
| Demographics | Rating | Rank | 10th Grade |
| German Russians | 96.3 /100 | #114 | Exceptional 94.4% |
| Delaware | 96.3 /100 | #115 | Exceptional 94.4% |
| Sioux | 96.2 /100 | #116 | Exceptional 94.4% |
| Immigrants | Hungary | 95.8 /100 | #117 | Exceptional 94.4% |
| Jordanians | 95.6 /100 | #118 | Exceptional 94.4% |
| Immigrants | Israel | 95.4 /100 | #119 | Exceptional 94.4% |
| Immigrants | Taiwan | 95.3 /100 | #120 | Exceptional 94.4% |
| Immigrants | Belarus | 95.2 /100 | #121 | Exceptional 94.4% |
| Inupiat | 95.1 /100 | #122 | Exceptional 94.4% |
| Cree | 95.1 /100 | #123 | Exceptional 94.4% |
| Basques | 94.9 /100 | #124 | Exceptional 94.3% |
| Americans | 94.4 /100 | #125 | Exceptional 94.3% |
| Immigrants | Iran | 94.4 /100 | #126 | Exceptional 94.3% |
| Israelis | 93.8 /100 | #127 | Exceptional 94.3% |
| Potawatomi | 93.6 /100 | #128 | Exceptional 94.3% |