Jordanian vs Immigrants from West Indies 10th Grade
COMPARE
Jordanian
Immigrants from West Indies
10th Grade
10th Grade Comparison
Jordanians
Immigrants from West Indies
94.4%
10TH GRADE
95.6/ 100
METRIC RATING
118th/ 347
METRIC RANK
91.8%
10TH GRADE
0.0/ 100
METRIC RATING
291st/ 347
METRIC RANK
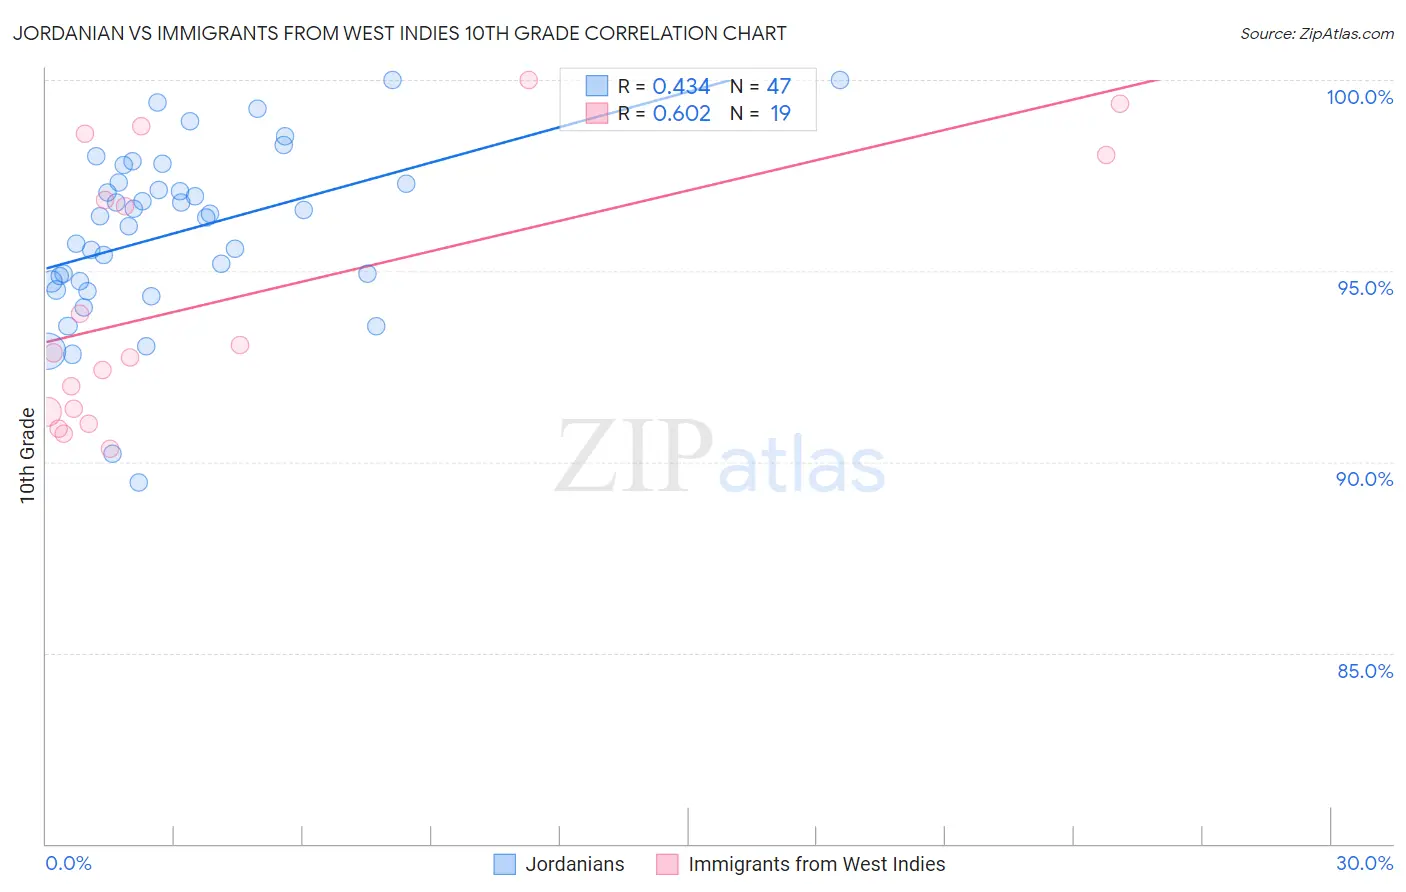
Jordanian vs Immigrants from West Indies 10th Grade Correlation Chart
The statistical analysis conducted on geographies consisting of 166,402,085 people shows a moderate positive correlation between the proportion of Jordanians and percentage of population with at least 10th grade education in the United States with a correlation coefficient (R) of 0.434 and weighted average of 94.4%. Similarly, the statistical analysis conducted on geographies consisting of 72,457,514 people shows a significant positive correlation between the proportion of Immigrants from West Indies and percentage of population with at least 10th grade education in the United States with a correlation coefficient (R) of 0.602 and weighted average of 91.8%, a difference of 2.8%.
10th Grade Correlation Summary
| Measurement | Jordanian | Immigrants from West Indies |
| Minimum | 89.5% | 90.4% |
| Maximum | 100.0% | 100.0% |
| Range | 10.5% | 9.6% |
| Mean | 96.0% | 94.3% |
| Median | 96.4% | 92.8% |
| Interquartile 25% (IQ1) | 94.7% | 91.3% |
| Interquartile 75% (IQ3) | 97.3% | 98.0% |
| Interquartile Range (IQR) | 2.6% | 6.7% |
| Standard Deviation (Sample) | 2.3% | 3.4% |
| Standard Deviation (Population) | 2.2% | 3.3% |
Similar Demographics by 10th Grade
Demographics Similar to Jordanians by 10th Grade
In terms of 10th grade, the demographic groups most similar to Jordanians are Immigrants from Hungary (94.4%, a difference of 0.010%), Immigrants from Israel (94.4%, a difference of 0.010%), Immigrants from Taiwan (94.4%, a difference of 0.010%), Immigrants from Belarus (94.4%, a difference of 0.020%), and Inupiat (94.4%, a difference of 0.020%).
| Demographics | Rating | Rank | 10th Grade |
| Immigrants | Zimbabwe | 96.8 /100 | #111 | Exceptional 94.4% |
| Immigrants | Kuwait | 96.8 /100 | #112 | Exceptional 94.4% |
| Palestinians | 96.5 /100 | #113 | Exceptional 94.4% |
| German Russians | 96.3 /100 | #114 | Exceptional 94.4% |
| Delaware | 96.3 /100 | #115 | Exceptional 94.4% |
| Sioux | 96.2 /100 | #116 | Exceptional 94.4% |
| Immigrants | Hungary | 95.8 /100 | #117 | Exceptional 94.4% |
| Jordanians | 95.6 /100 | #118 | Exceptional 94.4% |
| Immigrants | Israel | 95.4 /100 | #119 | Exceptional 94.4% |
| Immigrants | Taiwan | 95.3 /100 | #120 | Exceptional 94.4% |
| Immigrants | Belarus | 95.2 /100 | #121 | Exceptional 94.4% |
| Inupiat | 95.1 /100 | #122 | Exceptional 94.4% |
| Cree | 95.1 /100 | #123 | Exceptional 94.4% |
| Basques | 94.9 /100 | #124 | Exceptional 94.3% |
| Americans | 94.4 /100 | #125 | Exceptional 94.3% |
Demographics Similar to Immigrants from West Indies by 10th Grade
In terms of 10th grade, the demographic groups most similar to Immigrants from West Indies are British West Indian (91.8%, a difference of 0.0%), Immigrants from Burma/Myanmar (91.8%, a difference of 0.0%), Indonesian (91.8%, a difference of 0.020%), Sri Lankan (91.8%, a difference of 0.030%), and Pennsylvania German (91.9%, a difference of 0.060%).
| Demographics | Rating | Rank | 10th Grade |
| Immigrants | Barbados | 0.0 /100 | #284 | Tragic 92.1% |
| Immigrants | South Eastern Asia | 0.0 /100 | #285 | Tragic 92.1% |
| Yuman | 0.0 /100 | #286 | Tragic 92.0% |
| Pennsylvania Germans | 0.0 /100 | #287 | Tragic 91.9% |
| Immigrants | Laos | 0.0 /100 | #288 | Tragic 91.9% |
| Sri Lankans | 0.0 /100 | #289 | Tragic 91.8% |
| British West Indians | 0.0 /100 | #290 | Tragic 91.8% |
| Immigrants | West Indies | 0.0 /100 | #291 | Tragic 91.8% |
| Immigrants | Burma/Myanmar | 0.0 /100 | #292 | Tragic 91.8% |
| Indonesians | 0.0 /100 | #293 | Tragic 91.8% |
| Haitians | 0.0 /100 | #294 | Tragic 91.8% |
| Lumbee | 0.0 /100 | #295 | Tragic 91.7% |
| Immigrants | Grenada | 0.0 /100 | #296 | Tragic 91.6% |
| Fijians | 0.0 /100 | #297 | Tragic 91.5% |
| Cubans | 0.0 /100 | #298 | Tragic 91.5% |