Luxembourger vs Immigrants from West Indies 10th Grade
COMPARE
Luxembourger
Immigrants from West Indies
10th Grade
10th Grade Comparison
Luxembourgers
Immigrants from West Indies
95.4%
10TH GRADE
100.0/ 100
METRIC RATING
28th/ 347
METRIC RANK
91.8%
10TH GRADE
0.0/ 100
METRIC RATING
291st/ 347
METRIC RANK
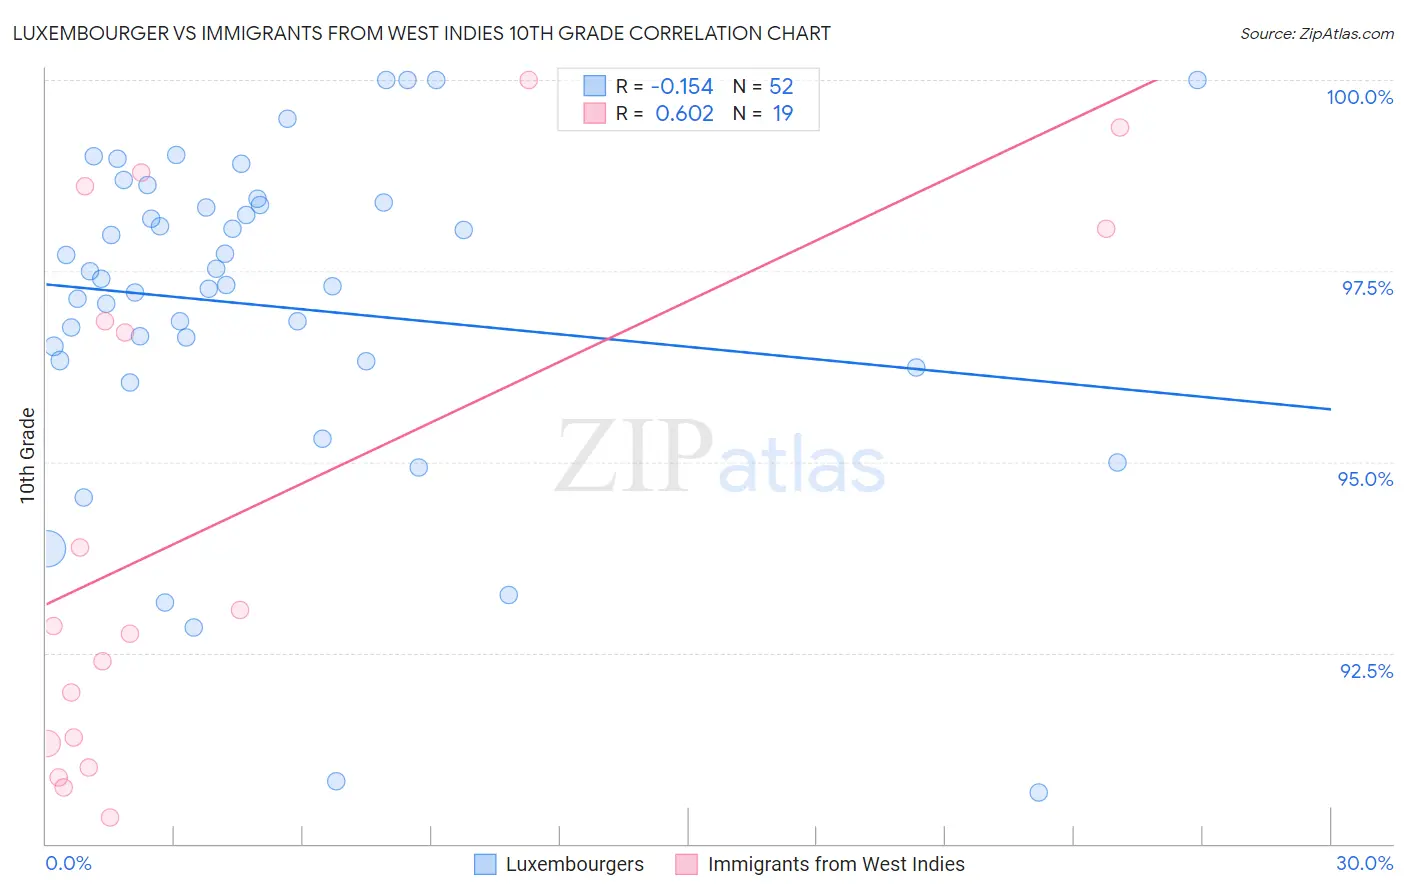
Luxembourger vs Immigrants from West Indies 10th Grade Correlation Chart
The statistical analysis conducted on geographies consisting of 144,675,955 people shows a poor negative correlation between the proportion of Luxembourgers and percentage of population with at least 10th grade education in the United States with a correlation coefficient (R) of -0.154 and weighted average of 95.4%. Similarly, the statistical analysis conducted on geographies consisting of 72,457,514 people shows a significant positive correlation between the proportion of Immigrants from West Indies and percentage of population with at least 10th grade education in the United States with a correlation coefficient (R) of 0.602 and weighted average of 91.8%, a difference of 3.9%.
10th Grade Correlation Summary
| Measurement | Luxembourger | Immigrants from West Indies |
| Minimum | 90.7% | 90.4% |
| Maximum | 100.0% | 100.0% |
| Range | 9.3% | 9.6% |
| Mean | 97.0% | 94.3% |
| Median | 97.4% | 92.8% |
| Interquartile 25% (IQ1) | 96.3% | 91.3% |
| Interquartile 75% (IQ3) | 98.4% | 98.0% |
| Interquartile Range (IQR) | 2.1% | 6.7% |
| Standard Deviation (Sample) | 2.1% | 3.4% |
| Standard Deviation (Population) | 2.1% | 3.3% |
Similar Demographics by 10th Grade
Demographics Similar to Luxembourgers by 10th Grade
In terms of 10th grade, the demographic groups most similar to Luxembourgers are Alaskan Athabascan (95.4%, a difference of 0.0%), Welsh (95.5%, a difference of 0.020%), Bulgarian (95.4%, a difference of 0.030%), European (95.5%, a difference of 0.040%), and Maltese (95.5%, a difference of 0.040%).
| Demographics | Rating | Rank | 10th Grade |
| Dutch | 100.0 /100 | #21 | Exceptional 95.5% |
| Eastern Europeans | 100.0 /100 | #22 | Exceptional 95.5% |
| Czechs | 100.0 /100 | #23 | Exceptional 95.5% |
| Europeans | 100.0 /100 | #24 | Exceptional 95.5% |
| Maltese | 100.0 /100 | #25 | Exceptional 95.5% |
| Welsh | 100.0 /100 | #26 | Exceptional 95.5% |
| Alaskan Athabascans | 100.0 /100 | #27 | Exceptional 95.4% |
| Luxembourgers | 100.0 /100 | #28 | Exceptional 95.4% |
| Bulgarians | 100.0 /100 | #29 | Exceptional 95.4% |
| Belgians | 100.0 /100 | #30 | Exceptional 95.4% |
| Iranians | 100.0 /100 | #31 | Exceptional 95.3% |
| Hungarians | 100.0 /100 | #32 | Exceptional 95.3% |
| French | 100.0 /100 | #33 | Exceptional 95.3% |
| British | 99.9 /100 | #34 | Exceptional 95.3% |
| Estonians | 99.9 /100 | #35 | Exceptional 95.3% |
Demographics Similar to Immigrants from West Indies by 10th Grade
In terms of 10th grade, the demographic groups most similar to Immigrants from West Indies are British West Indian (91.8%, a difference of 0.0%), Immigrants from Burma/Myanmar (91.8%, a difference of 0.0%), Indonesian (91.8%, a difference of 0.020%), Sri Lankan (91.8%, a difference of 0.030%), and Pennsylvania German (91.9%, a difference of 0.060%).
| Demographics | Rating | Rank | 10th Grade |
| Immigrants | Barbados | 0.0 /100 | #284 | Tragic 92.1% |
| Immigrants | South Eastern Asia | 0.0 /100 | #285 | Tragic 92.1% |
| Yuman | 0.0 /100 | #286 | Tragic 92.0% |
| Pennsylvania Germans | 0.0 /100 | #287 | Tragic 91.9% |
| Immigrants | Laos | 0.0 /100 | #288 | Tragic 91.9% |
| Sri Lankans | 0.0 /100 | #289 | Tragic 91.8% |
| British West Indians | 0.0 /100 | #290 | Tragic 91.8% |
| Immigrants | West Indies | 0.0 /100 | #291 | Tragic 91.8% |
| Immigrants | Burma/Myanmar | 0.0 /100 | #292 | Tragic 91.8% |
| Indonesians | 0.0 /100 | #293 | Tragic 91.8% |
| Haitians | 0.0 /100 | #294 | Tragic 91.8% |
| Lumbee | 0.0 /100 | #295 | Tragic 91.7% |
| Immigrants | Grenada | 0.0 /100 | #296 | Tragic 91.6% |
| Fijians | 0.0 /100 | #297 | Tragic 91.5% |
| Cubans | 0.0 /100 | #298 | Tragic 91.5% |