Spanish American vs Immigrants from West Indies Unemployment Among Ages 25 to 29 years
COMPARE
Spanish American
Immigrants from West Indies
Unemployment Among Ages 25 to 29 years
Unemployment Among Ages 25 to 29 years Comparison
Spanish Americans
Immigrants from West Indies
7.0%
UNEMPLOYMENT AMONG AGES 25 TO 29 YEARS
2.7/ 100
METRIC RATING
232nd/ 347
METRIC RANK
7.8%
UNEMPLOYMENT AMONG AGES 25 TO 29 YEARS
0.0/ 100
METRIC RATING
296th/ 347
METRIC RANK
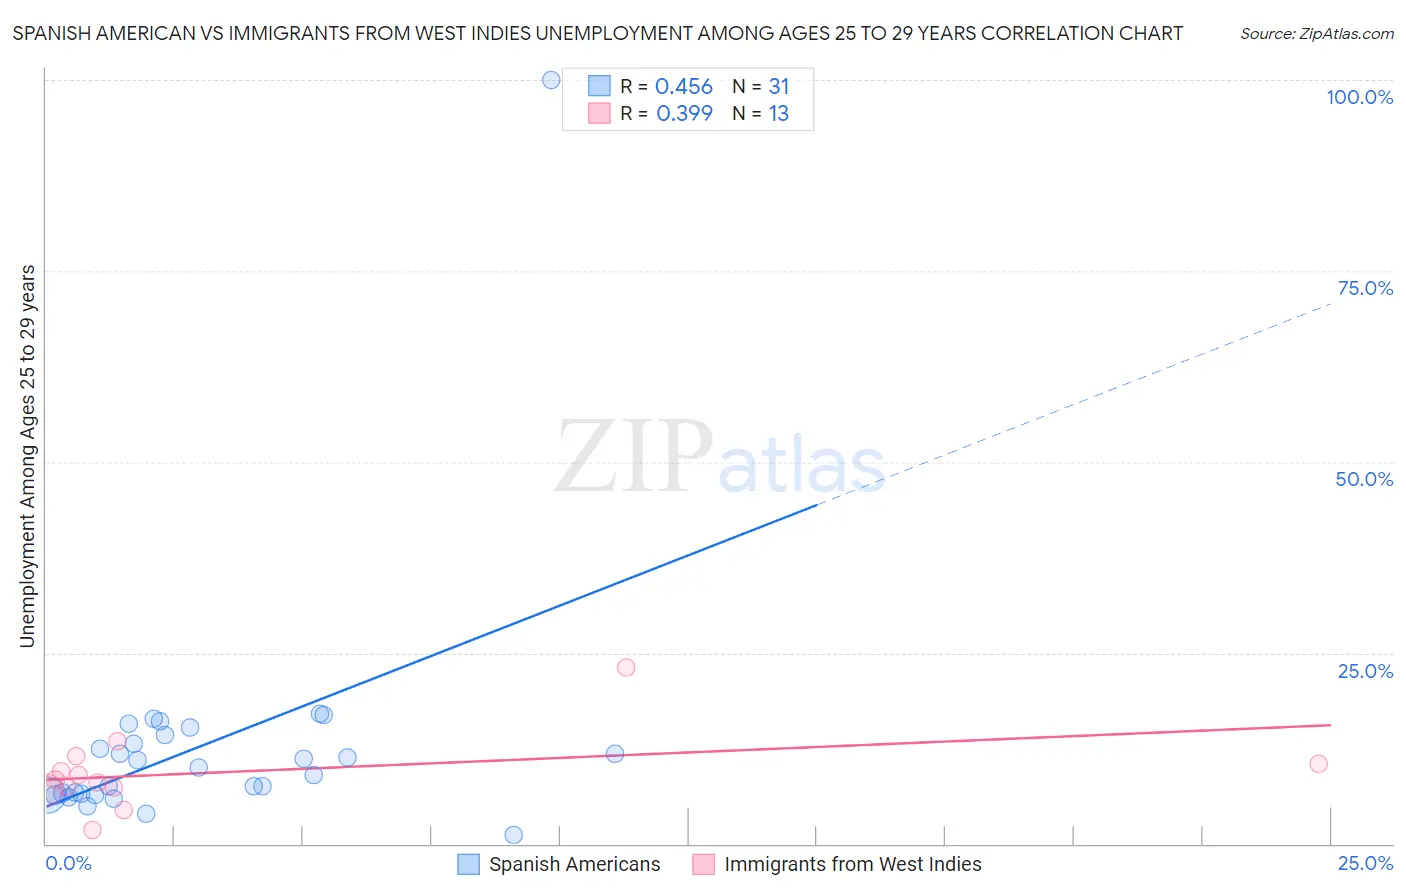
Spanish American vs Immigrants from West Indies Unemployment Among Ages 25 to 29 years Correlation Chart
The statistical analysis conducted on geographies consisting of 101,823,557 people shows a moderate positive correlation between the proportion of Spanish Americans and unemployment rate among population between the ages 25 and 29 in the United States with a correlation coefficient (R) of 0.456 and weighted average of 7.0%. Similarly, the statistical analysis conducted on geographies consisting of 71,747,330 people shows a mild positive correlation between the proportion of Immigrants from West Indies and unemployment rate among population between the ages 25 and 29 in the United States with a correlation coefficient (R) of 0.399 and weighted average of 7.8%, a difference of 11.7%.
Unemployment Among Ages 25 to 29 years Correlation Summary
| Measurement | Spanish American | Immigrants from West Indies |
| Minimum | 1.1% | 1.8% |
| Maximum | 100.0% | 23.1% |
| Range | 98.9% | 21.3% |
| Mean | 12.8% | 9.4% |
| Median | 9.9% | 8.4% |
| Interquartile 25% (IQ1) | 6.5% | 7.2% |
| Interquartile 75% (IQ3) | 14.2% | 11.0% |
| Interquartile Range (IQR) | 7.7% | 3.8% |
| Standard Deviation (Sample) | 16.7% | 5.1% |
| Standard Deviation (Population) | 16.5% | 4.9% |
Similar Demographics by Unemployment Among Ages 25 to 29 years
Demographics Similar to Spanish Americans by Unemployment Among Ages 25 to 29 years
In terms of unemployment among ages 25 to 29 years, the demographic groups most similar to Spanish Americans are Central American (7.0%, a difference of 0.15%), Immigrants from Honduras (7.0%, a difference of 0.19%), French Canadian (7.0%, a difference of 0.21%), Panamanian (7.0%, a difference of 0.37%), and Immigrants from El Salvador (7.0%, a difference of 0.44%).
| Demographics | Rating | Rank | Unemployment Among Ages 25 to 29 years |
| Japanese | 5.4 /100 | #225 | Tragic 6.9% |
| Immigrants | Liberia | 4.8 /100 | #226 | Tragic 7.0% |
| Salvadorans | 4.4 /100 | #227 | Tragic 7.0% |
| Immigrants | Panama | 4.2 /100 | #228 | Tragic 7.0% |
| Bermudans | 3.8 /100 | #229 | Tragic 7.0% |
| Immigrants | El Salvador | 3.6 /100 | #230 | Tragic 7.0% |
| Central Americans | 3.0 /100 | #231 | Tragic 7.0% |
| Spanish Americans | 2.7 /100 | #232 | Tragic 7.0% |
| Immigrants | Honduras | 2.4 /100 | #233 | Tragic 7.0% |
| French Canadians | 2.4 /100 | #234 | Tragic 7.0% |
| Panamanians | 2.1 /100 | #235 | Tragic 7.0% |
| Cape Verdeans | 1.9 /100 | #236 | Tragic 7.0% |
| Puget Sound Salish | 1.8 /100 | #237 | Tragic 7.1% |
| Hondurans | 1.8 /100 | #238 | Tragic 7.1% |
| Potawatomi | 1.3 /100 | #239 | Tragic 7.1% |
Demographics Similar to Immigrants from West Indies by Unemployment Among Ages 25 to 29 years
In terms of unemployment among ages 25 to 29 years, the demographic groups most similar to Immigrants from West Indies are Comanche (7.8%, a difference of 0.13%), Blackfeet (7.9%, a difference of 0.42%), Trinidadian and Tobagonian (7.8%, a difference of 0.59%), Immigrants from Trinidad and Tobago (7.9%, a difference of 0.68%), and Barbadian (7.9%, a difference of 0.86%).
| Demographics | Rating | Rank | Unemployment Among Ages 25 to 29 years |
| Belizeans | 0.0 /100 | #289 | Tragic 7.7% |
| Armenians | 0.0 /100 | #290 | Tragic 7.7% |
| Hispanics or Latinos | 0.0 /100 | #291 | Tragic 7.7% |
| Chippewa | 0.0 /100 | #292 | Tragic 7.8% |
| Immigrants | Belize | 0.0 /100 | #293 | Tragic 7.8% |
| Trinidadians and Tobagonians | 0.0 /100 | #294 | Tragic 7.8% |
| Comanche | 0.0 /100 | #295 | Tragic 7.8% |
| Immigrants | West Indies | 0.0 /100 | #296 | Tragic 7.8% |
| Blackfeet | 0.0 /100 | #297 | Tragic 7.9% |
| Immigrants | Trinidad and Tobago | 0.0 /100 | #298 | Tragic 7.9% |
| Barbadians | 0.0 /100 | #299 | Tragic 7.9% |
| Central American Indians | 0.0 /100 | #300 | Tragic 7.9% |
| West Indians | 0.0 /100 | #301 | Tragic 7.9% |
| Jamaicans | 0.0 /100 | #302 | Tragic 7.9% |
| Immigrants | Yemen | 0.0 /100 | #303 | Tragic 8.0% |